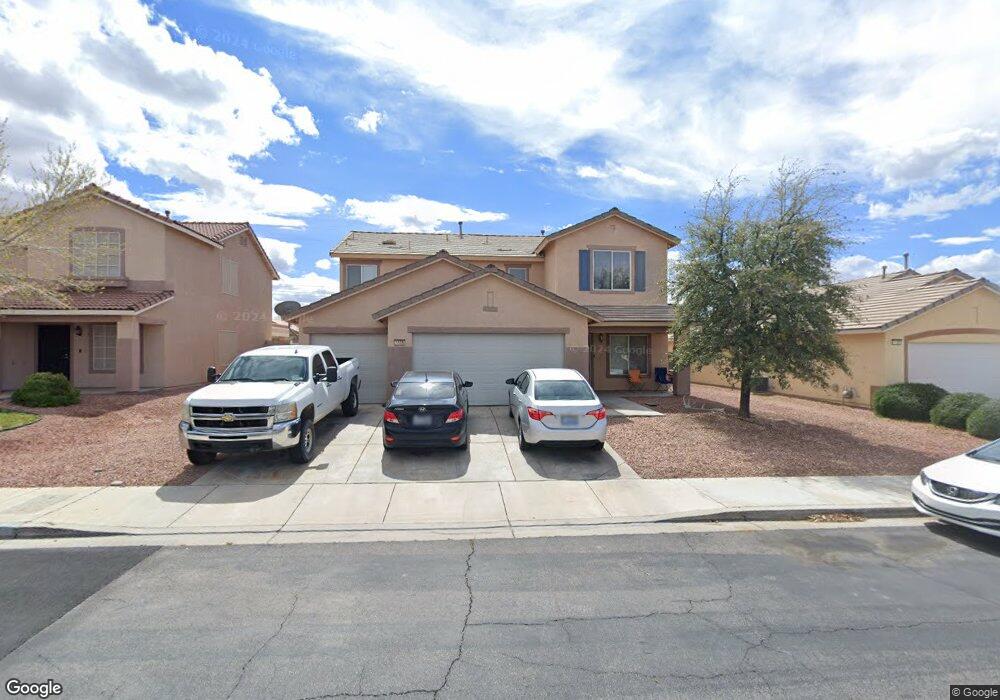
1109 Devon Downs Ave Henderson, NV 89015
River Mountain NeighborhoodEstimated Value: $499,000 - $526,000
4
Beds
3
Baths
2,436
Sq Ft
$210/Sq Ft
Est. Value
About This Home
This home is located at 1109 Devon Downs Ave, Henderson, NV 89015 and is currently estimated at $510,959, approximately $209 per square foot. 1109 Devon Downs Ave is a home located in Clark County with nearby schools including Sue H. Morrow Elementary School, B Mahlon Brown Academy of International Studies, and Basic Academy of International Studies.
Ownership History
Date
Name
Owned For
Owner Type
Purchase Details
Closed on
Feb 28, 2017
Sold by
Erickson Nancy R
Bought by
Erickson Drew S
Current Estimated Value
Home Financials for this Owner
Home Financials are based on the most recent Mortgage that was taken out on this home.
Original Mortgage
$256,000
Outstanding Balance
$209,934
Interest Rate
4.12%
Mortgage Type
VA
Estimated Equity
$301,025
Purchase Details
Closed on
May 5, 2016
Sold by
Erickson Nancy R
Bought by
Erickson Nancy R and Nancy Erickson Family Trust
Purchase Details
Closed on
May 27, 1998
Sold by
The Presley Companies
Bought by
Erickson Gunnar B and Erickson Nancy R
Home Financials for this Owner
Home Financials are based on the most recent Mortgage that was taken out on this home.
Original Mortgage
$140,950
Interest Rate
7.13%
Create a Home Valuation Report for This Property
The Home Valuation Report is an in-depth analysis detailing your home's value as well as a comparison with similar homes in the area
Home Values in the Area
Average Home Value in this Area
Purchase History
| Date | Buyer | Sale Price | Title Company |
|---|---|---|---|
| Erickson Drew S | -- | Nevada Title Las Vegas | |
| Erickson Nancy R | -- | None Available | |
| Erickson Gunnar B | $157,000 | First American Title Co |
Source: Public Records
Mortgage History
| Date | Status | Borrower | Loan Amount |
|---|---|---|---|
| Open | Erickson Drew S | $256,000 | |
| Previous Owner | Erickson Gunnar B | $140,950 |
Source: Public Records
Tax History
| Year | Tax Paid | Tax Assessment Tax Assessment Total Assessment is a certain percentage of the fair market value that is determined by local assessors to be the total taxable value of land and additions on the property. | Land | Improvement |
|---|---|---|---|---|
| 2026 | $2,377 | $122,186 | $39,900 | $82,286 |
| 2025 | $2,307 | $113,708 | $30,100 | $83,608 |
| 2024 | $2,241 | $113,708 | $30,100 | $83,608 |
| 2023 | $2,241 | $117,580 | $38,150 | $79,430 |
| 2022 | $2,385 | $104,515 | $31,850 | $72,665 |
| 2021 | $2,209 | $96,707 | $27,650 | $69,057 |
| 2020 | $2,048 | $95,050 | $26,600 | $68,450 |
| 2019 | $1,919 | $91,243 | $23,450 | $67,793 |
| 2018 | $1,831 | $83,814 | $18,900 | $64,914 |
| 2017 | $2,426 | $83,706 | $17,850 | $65,856 |
| 2016 | $1,715 | $76,762 | $10,850 | $65,912 |
| 2015 | $1,711 | $62,249 | $10,850 | $51,399 |
| 2014 | $1,661 | $60,405 | $9,450 | $50,955 |
Source: Public Records
Map
Nearby Homes
- 1109 Pincay Dr
- 573 Beryl Ct
- 551 Duran St
- 1008 Beaver Crest Terrace
- 585 Preakness Stakes St Unit 2A
- 531 Duran St
- 1044 Kennebunk Cir
- 626 Locust Grove St
- 994 River Walk Ct
- 1073 Featherwood Ave
- 881 Dunkirk River Ct
- 989 River Walk Ct
- 1137 Glistening Point Ave
- 698 S Racetrack Rd Unit 724
- 698 S Racetrack Rd Unit 1022
- 698 S Racetrack Rd Unit 1411
- 698 S Racetrack Rd Unit 1114
- 698 S Racetrack Rd Unit 1621
- 698 S Racetrack Rd Unit 713
- 1016 Huckburn Ave
- 1105 Devon Downs Ave
- 1113 Devon Downs Ave
- 1101 Devon Downs Ave Unit 4
- 1117 Devon Downs Ave
- 1108 Devon Downs Ave
- 1112 Devon Downs Ave Unit 4
- 1104 Devon Downs Ave
- 1121 Devon Downs Ave
- 1116 Devon Downs Ave
- 1097 Devon Downs Ave
- 1100 Devon Downs Ave
- 1120 Devon Downs Ave
- 1125 Devon Downs Ave
- 588 Estancia Ct
- 601 Broomspun St
- 588 Broomspun St
- 585 Estancia Ct
- 597 Broomspun St
- 597 Colonial Cup St
- 1036 Atticus Ave
Your Personal Tour Guide
Ask me questions while you tour the home.