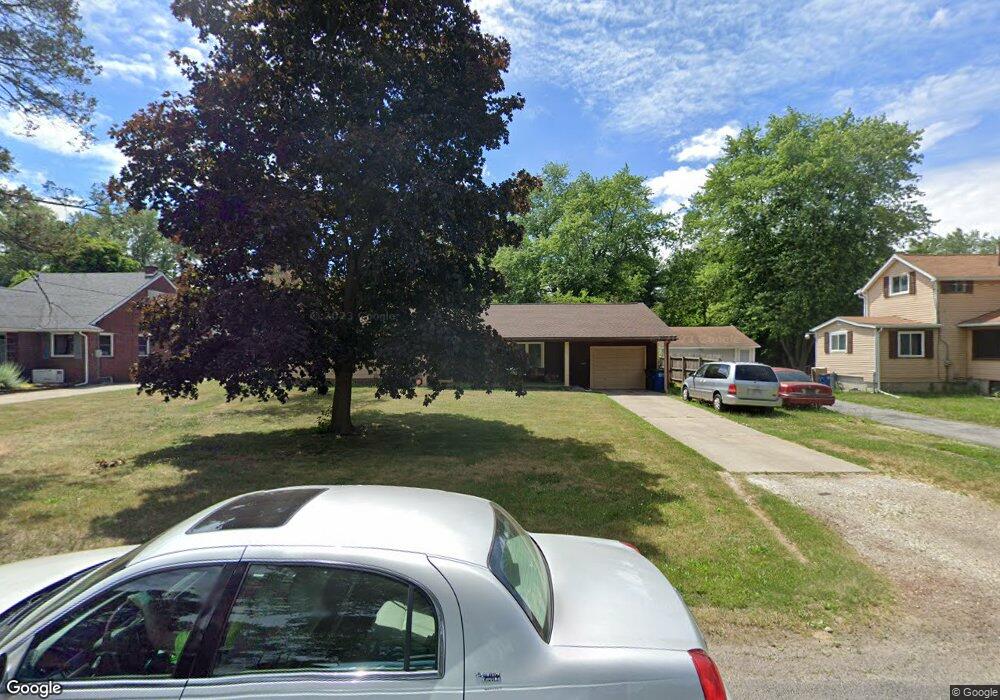
1109 Eton Rd Toledo, OH 43615
Reynolds Corners NeighborhoodEstimated Value: $152,000 - $180,000
3
Beds
2
Baths
1,370
Sq Ft
$119/Sq Ft
Est. Value
About This Home
This home is located at 1109 Eton Rd, Toledo, OH 43615 and is currently estimated at $162,876, approximately $118 per square foot. 1109 Eton Rd is a home located in Lucas County with nearby schools including McTigue Elementary School, Rogers High School, and St. Benedict Catholic School.
Ownership History
Date
Name
Owned For
Owner Type
Purchase Details
Closed on
Oct 26, 1998
Sold by
Rodesiler Richard S and Rodesiler Christina L
Bought by
Gray Keely M
Current Estimated Value
Home Financials for this Owner
Home Financials are based on the most recent Mortgage that was taken out on this home.
Original Mortgage
$93,300
Outstanding Balance
$19,110
Interest Rate
7.01%
Estimated Equity
$143,766
Purchase Details
Closed on
Nov 8, 1993
Sold by
Becker Lowell F and Becker Velda
Create a Home Valuation Report for This Property
The Home Valuation Report is an in-depth analysis detailing your home's value as well as a comparison with similar homes in the area
Home Values in the Area
Average Home Value in this Area
Purchase History
| Date | Buyer | Sale Price | Title Company |
|---|---|---|---|
| Gray Keely M | $94,000 | Midland | |
| -- | $75,000 | -- |
Source: Public Records
Mortgage History
| Date | Status | Borrower | Loan Amount |
|---|---|---|---|
| Open | Gray Keely M | $93,300 |
Source: Public Records
Tax History
| Year | Tax Paid | Tax Assessment Tax Assessment Total Assessment is a certain percentage of the fair market value that is determined by local assessors to be the total taxable value of land and additions on the property. | Land | Improvement |
|---|---|---|---|---|
| 2025 | -- | $39,165 | $8,645 | $30,520 |
| 2024 | $1,255 | $39,165 | $8,645 | $30,520 |
| 2023 | $2,564 | $34,685 | $7,700 | $26,985 |
| 2022 | $2,308 | $34,685 | $7,700 | $26,985 |
| 2021 | $2,387 | $34,685 | $7,700 | $26,985 |
| 2020 | $2,602 | $33,495 | $8,260 | $25,235 |
| 2019 | $2,517 | $33,495 | $8,260 | $25,235 |
| 2018 | $2,553 | $33,495 | $8,260 | $25,235 |
| 2017 | $2,559 | $32,760 | $8,085 | $24,675 |
| 2016 | $2,568 | $93,600 | $23,100 | $70,500 |
| 2015 | $2,581 | $93,600 | $23,100 | $70,500 |
| 2014 | $2,061 | $32,770 | $8,090 | $24,680 |
| 2013 | $2,061 | $32,770 | $8,090 | $24,680 |
Source: Public Records
Map
Nearby Homes
- 1207 Vanderbilt Rd
- 5809 Dorr St
- 5887 Globe Ave
- 914 Sawyer Rd
- 5665 Camberley Dr
- 715 N Holland Sylvania Rd Unit Lot 30
- 1911 N Holland Sylvania Rd
- 1950 Devinci Dr Unit A203
- 1137 Bedford Woods Dr
- 5925 Haefner Rd
- 2004 Oakside Rd
- 2015 Oakside Rd
- 2010 Oakside Rd
- 419 N Holland Sylvania Rd
- 5815 W Bancroft St
- 1944 Silverpine Ct
- 5845 Cook Dr
- 1809 Birdie Dr
- 630 Saturn Dr
- 5041 Ancil Rd
Your Personal Tour Guide
Ask me questions while you tour the home.