1109 Firth Ave Unit TWENTY Columbus, OH 43085
Devon Triangle NeighborhoodEstimated Value: $79,000 - $150,000
3
Beds
2
Baths
979
Sq Ft
$110/Sq Ft
Est. Value
About This Home
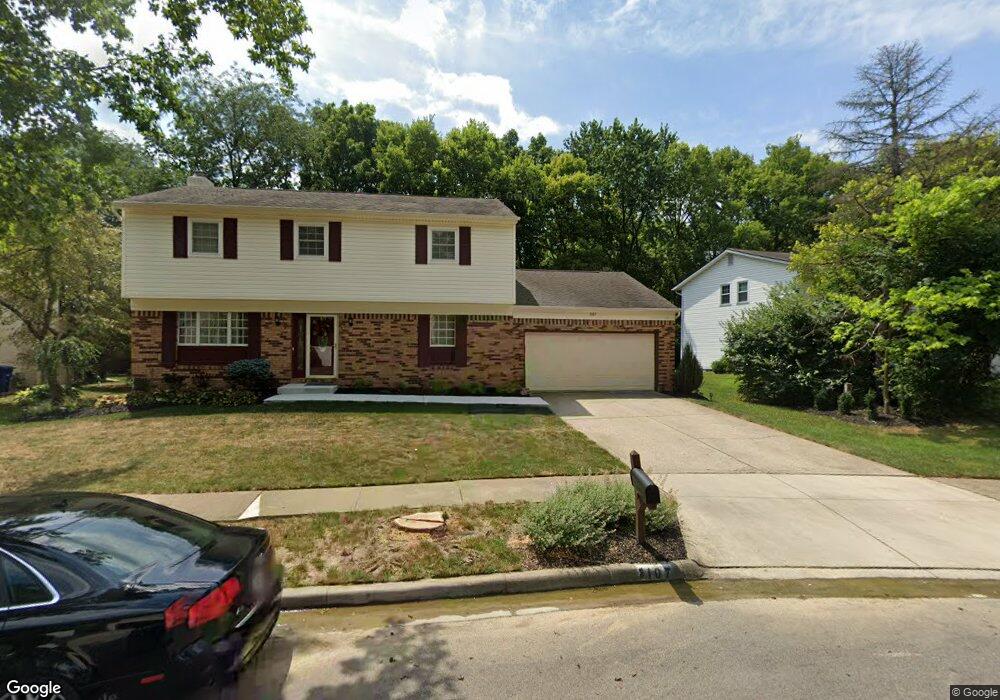
This home is located at 1109 Firth Ave Unit TWENTY, Columbus, OH 43085 and is currently estimated at $108,124, approximately $110 per square foot. 1109 Firth Ave Unit TWENTY is a home located in Franklin County with nearby schools including Windsor Stem Acadmey, Linden-Mckinley Stem School On Arcadia, and Columbus Performance Academy.
Ownership History
Date
Name
Owned For
Owner Type
Purchase Details
Closed on
Jun 13, 2022
Sold by
Jay Jordan Sr Freddie and Jay Tammi
Bought by
Acq Equity Llc
Current Estimated Value
Purchase Details
Closed on
May 23, 2022
Sold by
Jordan Freddie Jay and Jordan Tammi
Bought by
Acq Equity Llc
Purchase Details
Closed on
Feb 20, 2020
Sold by
Estate Of Eloise Jordan
Bought by
Oyoo Eloise
Purchase Details
Closed on
May 24, 1994
Create a Home Valuation Report for This Property
The Home Valuation Report is an in-depth analysis detailing your home's value as well as a comparison with similar homes in the area
Home Values in the Area
Average Home Value in this Area
Purchase History
| Date | Buyer | Sale Price | Title Company |
|---|---|---|---|
| Acq Equity Llc | $65,000 | Pm Title | |
| Acq Equity Llc | $65,000 | Pm Title | |
| Oyoo Eloise | -- | None Available | |
| -- | -- | -- |
Source: Public Records
Tax History Compared to Growth
Tax History
| Year | Tax Paid | Tax Assessment Tax Assessment Total Assessment is a certain percentage of the fair market value that is determined by local assessors to be the total taxable value of land and additions on the property. | Land | Improvement |
|---|---|---|---|---|
| 2024 | $1,190 | $22,690 | $5,220 | $17,470 |
| 2023 | $1,420 | $22,690 | $5,220 | $17,470 |
| 2022 | $1,002 | $16,490 | $2,560 | $13,930 |
| 2021 | $1,144 | $16,490 | $2,560 | $13,930 |
| 2020 | $959 | $16,490 | $2,560 | $13,930 |
| 2019 | $822 | $13,550 | $2,140 | $11,410 |
| 2018 | $820 | $13,550 | $2,140 | $11,410 |
| 2017 | $821 | $13,550 | $2,140 | $11,410 |
| 2016 | $902 | $13,620 | $2,870 | $10,750 |
| 2015 | $819 | $13,620 | $2,870 | $10,750 |
| 2014 | $821 | $13,620 | $2,870 | $10,750 |
| 2013 | $450 | $15,120 | $3,185 | $11,935 |
Source: Public Records
Map
Nearby Homes
- 1463 Gibbard Ave
- 0 Leona Ave
- 841 Saint Clair Ave
- 940 Shoemaker Ave
- 1082-1084 Peters Ave
- 997-999 Gibbard Ave
- 883 Mansfield Ave
- 1186 Saint Clair Ave
- 810-812 E 3rd Ave
- 570 N Ohio Ave
- 800-802 E Starr Ave
- 560 N Ohio Ave
- 940-942 Leona Ave
- 790-792 E Starr Ave
- 796 Gibbard Ave
- 542-544 Trevitt St
- 780-782 Gibbard Ave
- 779 Gibbard Ave
- 773-775 E 3rd Ave
- 927 Camden Ave
- 1113 Firth Ave Unit TWENTY
- 1103 Firth Ave Unit TWENTY
- 1117 Firth Ave Unit TWENTY
- 1125 Firth Ave Unit TWENTY
- 1129 Firth Ave Unit TWENTY
- 1106 Firth Ave Unit TWENTY
- 1118 Firth Ave Unit TWENTY
- 1122 Firth Ave Unit TWENTY
- 1128 Firth Ave Unit TWENTY
- 873 N 20th St
- 1424 Gibbard Ave
- 873 N 19th St
- 865 N 20th St
- 1608 Gibbard Ave
- 1474 Gibbard Ave
- 876 N 20th St
- 1195 E 5th Ave Unit REAR
- 1199 E 5th Ave
- 1133 Gibbard Ave
- 1205 E 5th Ave