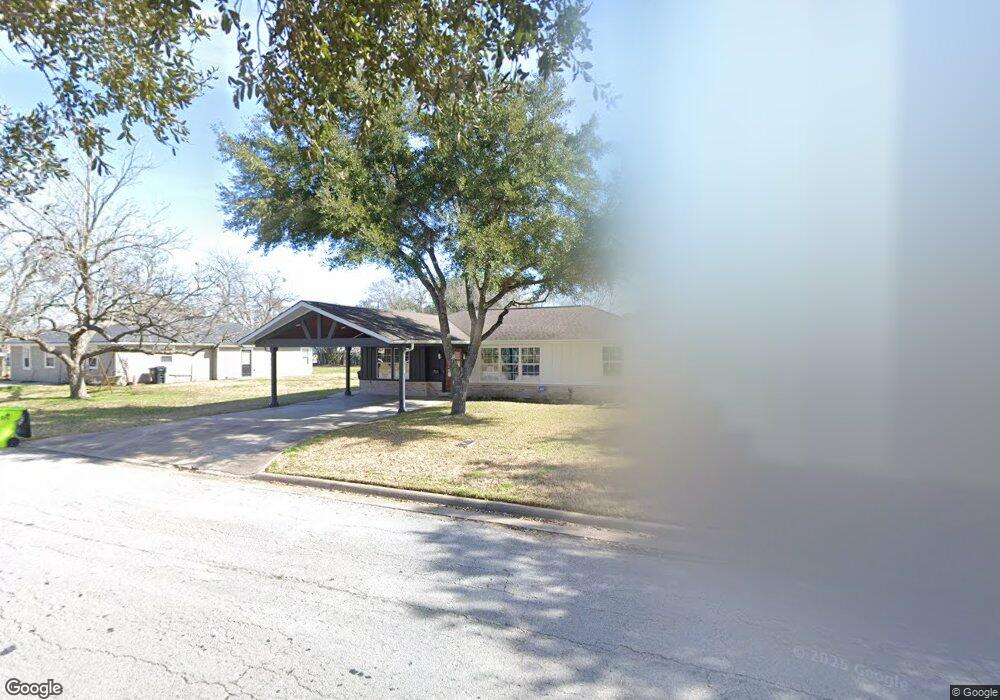
1109 George St Rosenberg, TX 77471
Estimated Value: $215,000 - $232,000
1
Bed
1
Bath
1,824
Sq Ft
$122/Sq Ft
Est. Value
About This Home
This home is located at 1109 George St, Rosenberg, TX 77471 and is currently estimated at $223,056, approximately $122 per square foot. 1109 George St is a home located in Fort Bend County with nearby schools including Bowie Elementary School, Navarro Middle School, and George Junior High School.
Ownership History
Date
Name
Owned For
Owner Type
Purchase Details
Closed on
Dec 10, 2021
Sold by
Severo Pina Jr
Bought by
Reese Jennifer Ladonna and Pina Severo
Current Estimated Value
Purchase Details
Closed on
Dec 26, 2012
Sold by
Pina Severo
Bought by
Pina Dolores Montana
Purchase Details
Closed on
Dec 21, 2012
Sold by
Pina Dolores Montana
Bought by
Pina Severo
Purchase Details
Closed on
Aug 2, 2001
Sold by
Pina Severo
Bought by
Pina Dolores Montana
Purchase Details
Closed on
Jun 15, 2000
Sold by
Bhimjee Tasneem
Bought by
Pina Severo and Pina Dolores M
Home Financials for this Owner
Home Financials are based on the most recent Mortgage that was taken out on this home.
Original Mortgage
$32,300
Interest Rate
8.3%
Purchase Details
Closed on
Jan 24, 2000
Sold by
Morris Suzanne Marie and Martin Jennifer Ann
Bought by
Bhimjee Tasneem
Create a Home Valuation Report for This Property
The Home Valuation Report is an in-depth analysis detailing your home's value as well as a comparison with similar homes in the area
Home Values in the Area
Average Home Value in this Area
Purchase History
| Date | Buyer | Sale Price | Title Company |
|---|---|---|---|
| Reese Jennifer Ladonna | -- | Levin & Atwood Llp | |
| Pina Dolores Montana | -- | None Available | |
| Pina Severo | -- | None Available | |
| Pina Dolores Montana | -- | -- | |
| Pina Severo | -- | Startex Title Company | |
| Bhimjee Tasneem | -- | Startex Title |
Source: Public Records
Mortgage History
| Date | Status | Borrower | Loan Amount |
|---|---|---|---|
| Previous Owner | Pina Severo | $32,300 | |
| Closed | Pina Dolores Montana | $0 |
Source: Public Records
Tax History Compared to Growth
Tax History
| Year | Tax Paid | Tax Assessment Tax Assessment Total Assessment is a certain percentage of the fair market value that is determined by local assessors to be the total taxable value of land and additions on the property. | Land | Improvement |
|---|---|---|---|---|
| 2025 | $2,654 | $240,208 | $69,972 | $177,180 |
| 2024 | $2,654 | $218,371 | $21,160 | $197,211 |
| 2023 | $4,108 | $212,803 | $37,482 | $175,321 |
| 2022 | $3,252 | $158,790 | $37,480 | $121,310 |
| 2021 | $3,202 | $154,340 | $41,730 | $112,610 |
| 2020 | $3,272 | $154,160 | $47,870 | $106,290 |
| 2019 | $3,202 | $140,210 | $23,140 | $117,070 |
| 2018 | $2,563 | $110,410 | $23,140 | $87,270 |
| 2017 | $2,405 | $103,020 | $23,140 | $79,880 |
| 2016 | $2,200 | $94,240 | $23,140 | $71,100 |
| 2015 | $2,107 | $89,790 | $23,140 | $66,650 |
| 2014 | $1,945 | $81,920 | $23,140 | $58,780 |
Source: Public Records
Map
Nearby Homes
- 1112 James St
- 3326 Tilley Dr
- 805 Avenue J
- 1220 Mulcahy St
- 614 Mulcahy St
- 1210 Avenue E
- 1418 Carlisle St
- 1400 Dyer Ave
- 735 Willow St
- 2606 Wastelbread Ln
- 2523 Good Morrow Dr
- 2527 Good Morrow Dr
- 2622 Good Morrow Dr
- 2507 Good Morrow Dr
- 2614 Good Morrow Dr
- 503 Willow St
- 915 Avenue E
- 1605 Walnut Ave
- 2618 Wastelbread Ln
- 2519 Good Morrow Dr