Estimated Value: $75,423 - $88,000
2
Beds
2
Baths
1,256
Sq Ft
$65/Sq Ft
Est. Value
About This Home
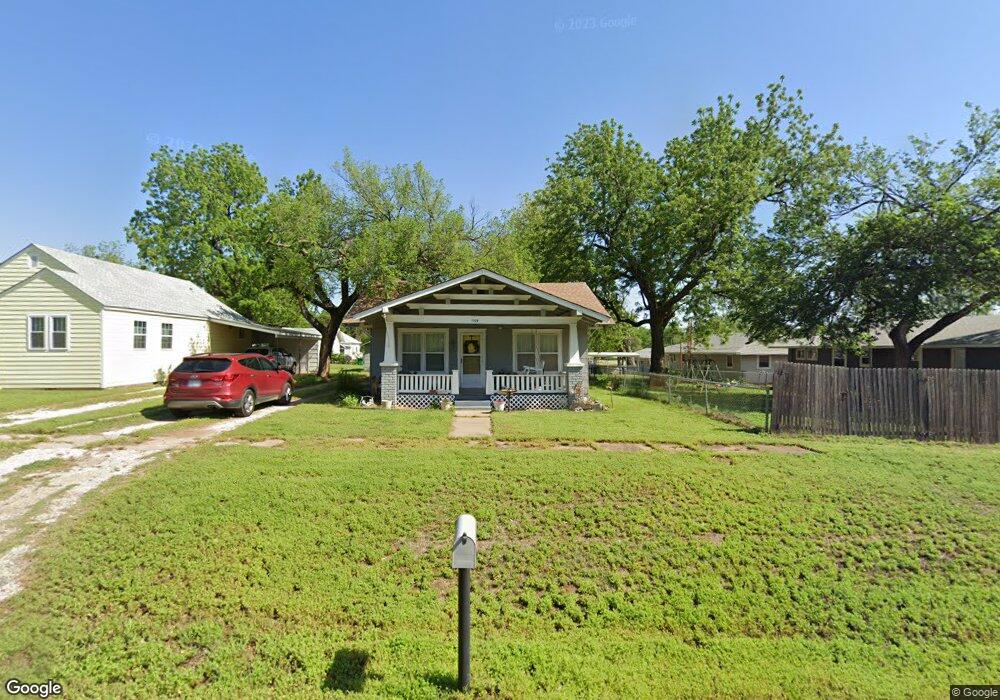
This home is located at 1109 Grove St, Perry, OK 73077 and is currently estimated at $81,856, approximately $65 per square foot. 1109 Grove St is a home located in Noble County with nearby schools including Perry Elementary School and Perry High School.
Ownership History
Date
Name
Owned For
Owner Type
Purchase Details
Closed on
Nov 24, 2025
Sold by
Mcgalliard Kris
Bought by
Perry Realty Holdings Llc
Current Estimated Value
Home Financials for this Owner
Home Financials are based on the most recent Mortgage that was taken out on this home.
Original Mortgage
$81,865
Interest Rate
10%
Mortgage Type
Construction
Purchase Details
Closed on
Mar 17, 2022
Sold by
Williamson and Shelli
Bought by
Mcmcgalliard Kris Mc
Home Financials for this Owner
Home Financials are based on the most recent Mortgage that was taken out on this home.
Original Mortgage
$54,414
Interest Rate
4.16%
Mortgage Type
New Conventional
Purchase Details
Closed on
Jun 23, 2017
Sold by
Leroy J Rolling Living Trust
Bought by
Williamson Kevin and Williamson Shelli
Purchase Details
Closed on
Feb 12, 2001
Sold by
Leroy Rolling
Bought by
Leroy Rolling Living Trus
Create a Home Valuation Report for This Property
The Home Valuation Report is an in-depth analysis detailing your home's value as well as a comparison with similar homes in the area
Home Values in the Area
Average Home Value in this Area
Purchase History
| Date | Buyer | Sale Price | Title Company |
|---|---|---|---|
| Perry Realty Holdings Llc | $80,000 | Alliant National Title | |
| Mcmcgalliard Kris Mc | $43,000 | None Listed On Document | |
| Williamson Kevin | $13,000 | None Available | |
| Leroy Rolling Living Trus | -- | -- |
Source: Public Records
Mortgage History
| Date | Status | Borrower | Loan Amount |
|---|---|---|---|
| Closed | Perry Realty Holdings Llc | $81,865 | |
| Previous Owner | Mcmcgalliard Kris Mc | $54,414 |
Source: Public Records
Tax History
| Year | Tax Paid | Tax Assessment Tax Assessment Total Assessment is a certain percentage of the fair market value that is determined by local assessors to be the total taxable value of land and additions on the property. | Land | Improvement |
|---|---|---|---|---|
| 2025 | $507 | $4,946 | $173 | $4,773 |
| 2024 | $492 | $4,946 | $173 | $4,773 |
| 2023 | $485 | $4,946 | $173 | $4,773 |
| 2022 | $178 | $1,818 | $173 | $1,645 |
| 2021 | $186 | $1,818 | $173 | $1,645 |
| 2020 | $174 | $1,649 | $173 | $1,476 |
| 2019 | $159 | $1,571 | $173 | $1,398 |
| 2018 | $155 | $1,496 | $173 | $1,323 |
| 2017 | $276 | $3,718 | $160 | $3,558 |
| 2016 | $263 | $3,610 | $242 | $3,368 |
| 2015 | $260 | $3,505 | $242 | $3,263 |
| 2014 | $252 | $3,403 | $242 | $3,161 |
Source: Public Records
Map
Nearby Homes
Your Personal Tour Guide
Ask me questions while you tour the home.