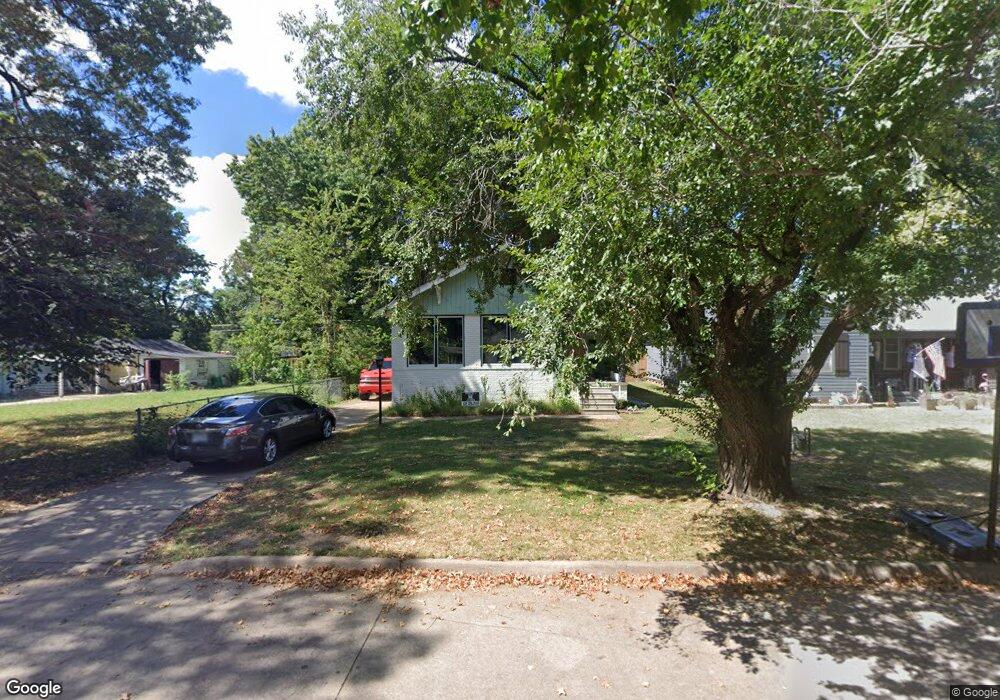
1109 Maple St Muskogee, OK 74403
Central Muskogee NeighborhoodEstimated Value: $63,000 - $96,000
3
Beds
1
Bath
860
Sq Ft
$96/Sq Ft
Est. Value
About This Home
This home is located at 1109 Maple St, Muskogee, OK 74403 and is currently estimated at $82,353, approximately $95 per square foot. 1109 Maple St is a home located in Muskogee County with nearby schools including Irving Elementary School, 8th & 9th Grade Academy @ Alice Robertson, and Muskogee High School.
Ownership History
Date
Name
Owned For
Owner Type
Purchase Details
Closed on
Dec 23, 2008
Sold by
Nichols Cathey and Nichols Ricky J
Bought by
Nichols Ricky D
Current Estimated Value
Purchase Details
Closed on
May 25, 2005
Sold by
Federal National Mortgage Association
Bought by
Cowan Julian J
Purchase Details
Closed on
Jan 21, 2005
Sold by
Petchinsky Judith Lee and Doe John
Bought by
Chase Manhattan Mortgage Corp
Purchase Details
Closed on
Sep 23, 1999
Purchase Details
Closed on
Jan 1, 1992
Purchase Details
Closed on
Dec 1, 1991
Purchase Details
Closed on
May 1, 1991
Create a Home Valuation Report for This Property
The Home Valuation Report is an in-depth analysis detailing your home's value as well as a comparison with similar homes in the area
Home Values in the Area
Average Home Value in this Area
Purchase History
| Date | Buyer | Sale Price | Title Company |
|---|---|---|---|
| Nichols Ricky D | -- | None Available | |
| Cowan Julian J | -- | None Available | |
| Chase Manhattan Mortgage Corp | $21,035 | Oklahoma Title 68 | |
| -- | $18,000 | -- | |
| -- | $16,500 | -- | |
| -- | -- | -- | |
| -- | -- | -- |
Source: Public Records
Tax History Compared to Growth
Tax History
| Year | Tax Paid | Tax Assessment Tax Assessment Total Assessment is a certain percentage of the fair market value that is determined by local assessors to be the total taxable value of land and additions on the property. | Land | Improvement |
|---|---|---|---|---|
| 2024 | $415 | $3,812 | $861 | $2,951 |
| 2023 | $415 | $3,630 | $598 | $3,032 |
| 2022 | $362 | $3,630 | $598 | $3,032 |
| 2021 | $377 | $3,769 | $550 | $3,219 |
| 2020 | $372 | $3,708 | $550 | $3,158 |
| 2019 | $351 | $3,769 | $550 | $3,219 |
| 2018 | $328 | $3,769 | $550 | $3,219 |
| 2017 | $302 | $3,203 | $550 | $2,653 |
| 2016 | $290 | $3,051 | $550 | $2,501 |
| 2015 | $288 | $3,051 | $550 | $2,501 |
| 2014 | $293 | $3,051 | $550 | $2,501 |
Source: Public Records
Map
Nearby Homes