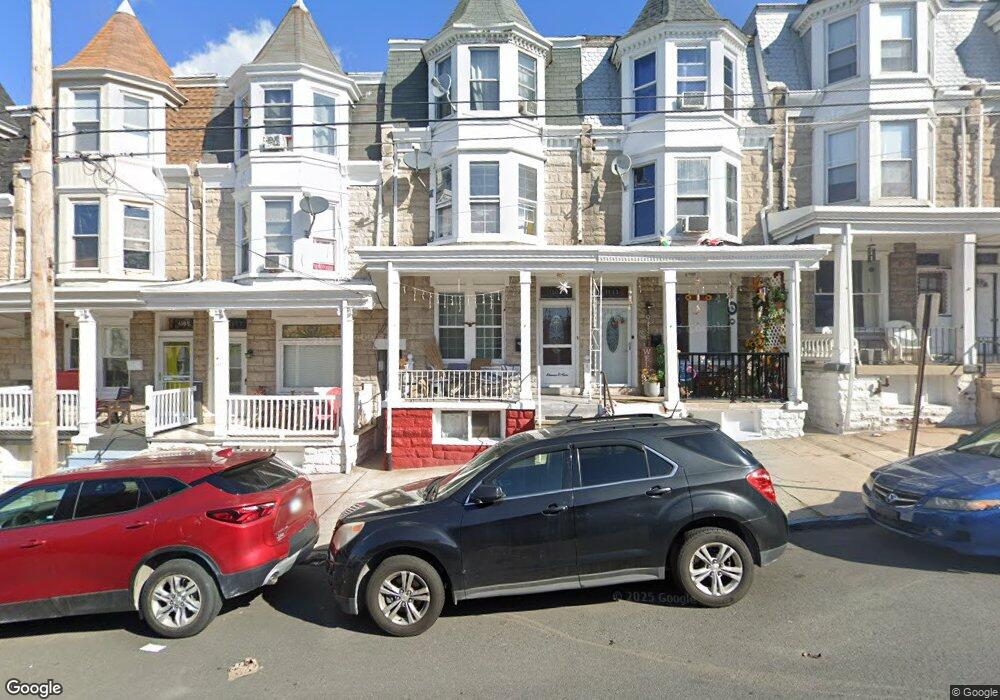
1109 Marion St Reading, PA 19604
Northeast Reading NeighborhoodEstimated Value: $168,115 - $230,000
5
Beds
1
Bath
2,024
Sq Ft
$98/Sq Ft
Est. Value
About This Home
This home is located at 1109 Marion St, Reading, PA 19604 and is currently estimated at $199,029, approximately $98 per square foot. 1109 Marion St is a home located in Berks County with nearby schools including Twelfth & Marion Elementary School, Northeast Middle School, and Reading Senior High School.
Ownership History
Date
Name
Owned For
Owner Type
Purchase Details
Closed on
Oct 24, 2014
Sold by
Irineo Gilberto
Bought by
Irineo Jesus Luna and Irineo De Los Santos Rosaura
Current Estimated Value
Home Financials for this Owner
Home Financials are based on the most recent Mortgage that was taken out on this home.
Original Mortgage
$39,275
Outstanding Balance
$12,648
Interest Rate
3.25%
Mortgage Type
FHA
Estimated Equity
$186,381
Purchase Details
Closed on
Oct 16, 2006
Sold by
Johnson Patricia
Bought by
Irineo Gilberto
Home Financials for this Owner
Home Financials are based on the most recent Mortgage that was taken out on this home.
Original Mortgage
$54,000
Interest Rate
6.14%
Mortgage Type
New Conventional
Create a Home Valuation Report for This Property
The Home Valuation Report is an in-depth analysis detailing your home's value as well as a comparison with similar homes in the area
Home Values in the Area
Average Home Value in this Area
Purchase History
| Date | Buyer | Sale Price | Title Company |
|---|---|---|---|
| Irineo Jesus Luna | $40,000 | Conestoga Title Co | |
| Irineo Gilberto | $60,000 | None Available |
Source: Public Records
Mortgage History
| Date | Status | Borrower | Loan Amount |
|---|---|---|---|
| Open | Irineo Jesus Luna | $39,275 | |
| Previous Owner | Irineo Gilberto | $54,000 |
Source: Public Records
Tax History
| Year | Tax Paid | Tax Assessment Tax Assessment Total Assessment is a certain percentage of the fair market value that is determined by local assessors to be the total taxable value of land and additions on the property. | Land | Improvement |
|---|---|---|---|---|
| 2025 | $1,365 | $50,300 | $15,000 | $35,300 |
| 2024 | $2,234 | $50,300 | $15,000 | $35,300 |
| 2023 | $2,199 | $50,300 | $15,000 | $35,300 |
| 2022 | $2,199 | $50,300 | $15,000 | $35,300 |
| 2021 | $2,199 | $50,300 | $15,000 | $35,300 |
| 2020 | $2,177 | $50,300 | $15,000 | $35,300 |
| 2019 | $2,177 | $50,300 | $15,000 | $35,300 |
| 2018 | $2,177 | $50,300 | $15,000 | $35,300 |
| 2017 | $2,162 | $50,300 | $15,000 | $35,300 |
| 2016 | $1,235 | $50,300 | $15,000 | $35,300 |
| 2015 | $1,235 | $50,300 | $15,000 | $35,300 |
| 2014 | $1,137 | $50,300 | $15,000 | $35,300 |
Source: Public Records
Map
Nearby Homes
- 1147 Locust St
- 1139 Mulberry St
- 1042 Locust St
- 1007 N 11th St
- 1021 Mulberry St
- 1231 Perry St
- 942 N 11th St
- 1026 Hampden Blvd
- 1343 Mulberry St
- 1347 Mulberry St
- 1361 Locust St
- 1240 Spring St
- 1209 Linden St
- 1200 Hampden Blvd
- 1319 Perry St
- 1357 N 10th St
- 1217 Windsor St
- 910 Pike St
- 1115 Douglass St
- 1425 N 13th St
Your Personal Tour Guide
Ask me questions while you tour the home.