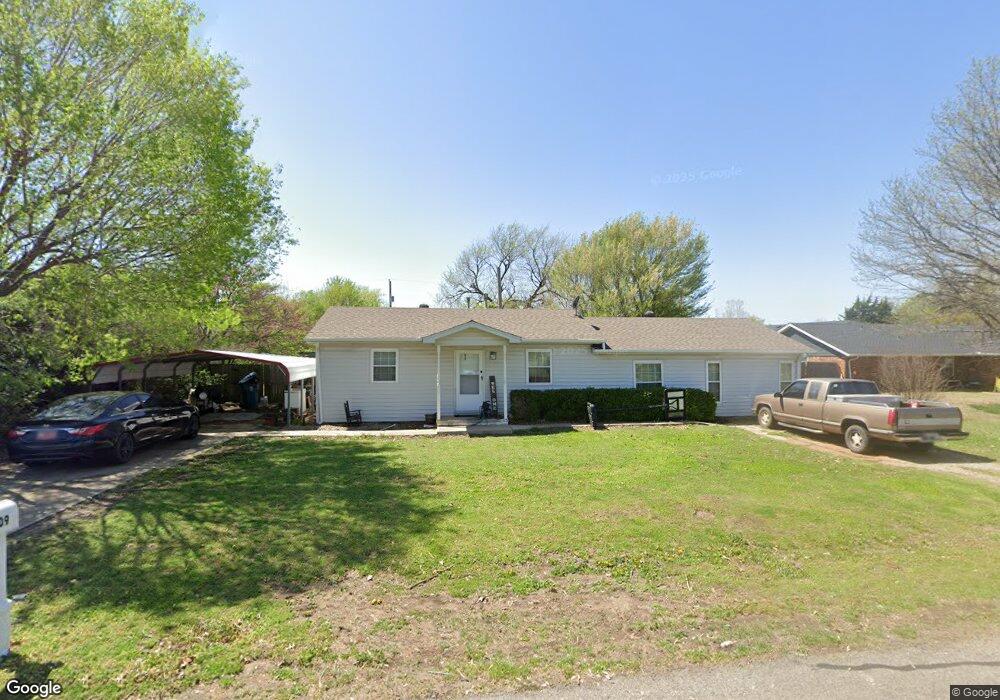
1109 N Carr Dr Newcastle, OK 73065
Estimated Value: $180,000 - $197,602
3
Beds
2
Baths
1,344
Sq Ft
$141/Sq Ft
Est. Value
About This Home
This home is located at 1109 N Carr Dr, Newcastle, OK 73065 and is currently estimated at $189,651, approximately $141 per square foot. 1109 N Carr Dr is a home located in McClain County with nearby schools including Newcastle Elementary School, Newcastle Middle School, and Newcastle High School.
Ownership History
Date
Name
Owned For
Owner Type
Purchase Details
Closed on
Jan 23, 2023
Sold by
Haile Matthew
Bought by
Haile Matthew and Colon-Lugo Karol
Current Estimated Value
Home Financials for this Owner
Home Financials are based on the most recent Mortgage that was taken out on this home.
Original Mortgage
$144,000
Interest Rate
6.33%
Purchase Details
Closed on
Dec 12, 2022
Sold by
Jackson Teri
Bought by
Haile Matthew
Home Financials for this Owner
Home Financials are based on the most recent Mortgage that was taken out on this home.
Original Mortgage
$144,000
Interest Rate
6.33%
Purchase Details
Closed on
Apr 17, 2014
Sold by
Parrish Dennis
Bought by
Jackson Teri
Purchase Details
Closed on
May 2, 2013
Sold by
Cornish Edna and Thomas Jack
Bought by
Parrish Dennis
Purchase Details
Closed on
Oct 22, 2002
Sold by
Glass Lonnie and Glass Sharon
Bought by
Thomas Leon and Thomas Ruth
Create a Home Valuation Report for This Property
The Home Valuation Report is an in-depth analysis detailing your home's value as well as a comparison with similar homes in the area
Home Values in the Area
Average Home Value in this Area
Purchase History
| Date | Buyer | Sale Price | Title Company |
|---|---|---|---|
| Haile Matthew | -- | None Listed On Document | |
| Haile Matthew | -- | None Listed On Document | |
| Haile Matthew | $160,000 | Old Republic Title | |
| Haile Matthew | $160,000 | Old Republic Title | |
| Jackson Teri | $107,500 | -- | |
| Parrish Dennis | $70,000 | None Available | |
| Thomas Leon | $75,000 | -- |
Source: Public Records
Mortgage History
| Date | Status | Borrower | Loan Amount |
|---|---|---|---|
| Previous Owner | Haile Matthew | $144,000 |
Source: Public Records
Tax History Compared to Growth
Tax History
| Year | Tax Paid | Tax Assessment Tax Assessment Total Assessment is a certain percentage of the fair market value that is determined by local assessors to be the total taxable value of land and additions on the property. | Land | Improvement |
|---|---|---|---|---|
| 2025 | $1,777 | $16,350 | $3,190 | $13,160 |
| 2024 | $1,777 | $16,497 | $3,190 | $13,307 |
| 2023 | $1,777 | $17,600 | $2,750 | $14,850 |
| 2022 | $1,091 | $10,453 | $2,399 | $8,054 |
| 2021 | $1,108 | $10,149 | $2,313 | $7,836 |
| 2020 | $1,077 | $9,853 | $2,229 | $7,624 |
| 2019 | $1,058 | $9,566 | $2,147 | $7,419 |
| 2018 | $1,008 | $9,288 | $2,039 | $7,249 |
| 2017 | $973 | $9,017 | $2,434 | $6,583 |
| 2016 | $945 | $8,755 | $1,650 | $7,105 |
| 2015 | $1,319 | $11,825 | $1,650 | $10,175 |
| 2014 | $992 | $8,250 | $1,650 | $6,600 |
Source: Public Records
Map
Nearby Homes
- 1100 N Doris Ave
- 1109 N Doris Ave
- 1013 N Carr Dr
- 375 NE 9th Place
- 303 Naomi Ln
- 908 NW 6th St
- 820 NW 5th St
- 808 Saint James Place
- 1009 NW 5th St
- 1657 Autumn Lane Ct
- 1012 NW 5th St
- 1009 NW 17th St
- 1116 Vermont Ave
- 2 S Main St
- 3 S Main St
- 1 S Main St
- 4 S Main St
- 5 S Main St
- 6 S Main St
- 501 Saint James Place
- 1113 N Carr Dr
- 1101 N Carr Dr
- 1108 N Doris Ave
- 1112 N Doris Ave
- 1021 N Carr Dr
- 1108 N Carr Dr
- 1112 N Carr Dr
- 1100 N Carr Dr
- 1120 N Doris Ave
- 1200 N Carr Dr
- 1205 N Carr Dr
- 1205 N Carr Dr
- 1020 N Doris Ave
- 1050 N Carr Dr
- 1204 N Doris Ave
- 1012 N Doris Ave
- 1204 N Carr Dr
- 1010 N Carr Dr
- 1208 N Carr Dr
- 1009 N Carr Dr