Estimated Value: $179,000 - $214,000
2
Beds
1
Bath
1,008
Sq Ft
$196/Sq Ft
Est. Value
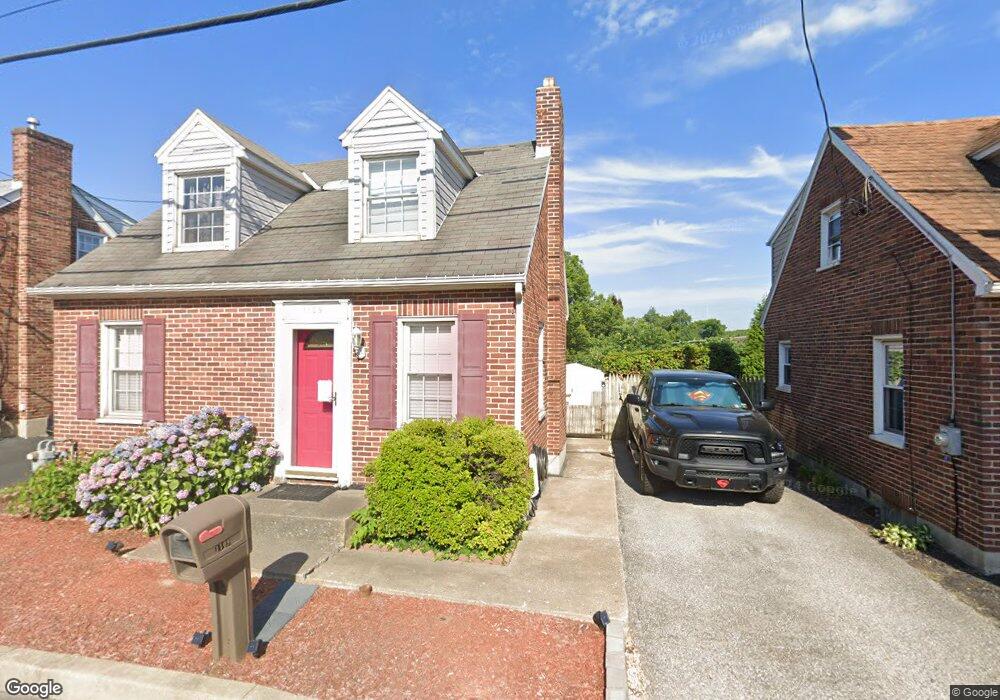
About This Home
This home is located at 1109 N Sherman St, York, PA 17402 and is currently estimated at $197,347, approximately $195 per square foot. 1109 N Sherman St is a home located in York County with nearby schools including Central York High School, Keystone Christian Academy - York, and Tidings of Peace Christian School.
Ownership History
Date
Name
Owned For
Owner Type
Purchase Details
Closed on
Apr 26, 2010
Sold by
Kohler Jed Eugene and Kohler Letitia J
Bought by
Mcwilliams Michele S
Current Estimated Value
Home Financials for this Owner
Home Financials are based on the most recent Mortgage that was taken out on this home.
Original Mortgage
$122,856
Outstanding Balance
$82,144
Interest Rate
5%
Mortgage Type
Seller Take Back
Estimated Equity
$115,203
Purchase Details
Closed on
Nov 14, 2002
Sold by
Kohler Jed Eugene
Bought by
Kohler Jed Eugene and Kohler Letitia J
Purchase Details
Closed on
Apr 13, 1998
Sold by
Kohler Jed E and Kohler Carol E
Bought by
Kohler Jed Eugene
Home Financials for this Owner
Home Financials are based on the most recent Mortgage that was taken out on this home.
Original Mortgage
$57,953
Interest Rate
6.98%
Create a Home Valuation Report for This Property
The Home Valuation Report is an in-depth analysis detailing your home's value as well as a comparison with similar homes in the area
Home Values in the Area
Average Home Value in this Area
Purchase History
| Date | Buyer | Sale Price | Title Company |
|---|---|---|---|
| Mcwilliams Michele S | $120,000 | None Available | |
| Kohler Jed Eugene | -- | -- | |
| Kohler Jed Eugene | -- | -- |
Source: Public Records
Mortgage History
| Date | Status | Borrower | Loan Amount |
|---|---|---|---|
| Open | Mcwilliams Michele S | $122,856 | |
| Previous Owner | Kohler Jed Eugene | $57,953 |
Source: Public Records
Tax History Compared to Growth
Tax History
| Year | Tax Paid | Tax Assessment Tax Assessment Total Assessment is a certain percentage of the fair market value that is determined by local assessors to be the total taxable value of land and additions on the property. | Land | Improvement |
|---|---|---|---|---|
| 2025 | $2,981 | $85,220 | $35,090 | $50,130 |
| 2024 | $2,505 | $85,220 | $35,090 | $50,130 |
| 2023 | $5,291 | $85,220 | $35,090 | $50,130 |
| 2022 | $5,260 | $85,220 | $35,090 | $50,130 |
| 2021 | $5,115 | $85,220 | $35,090 | $50,130 |
| 2020 | $4,994 | $85,220 | $35,090 | $50,130 |
| 2019 | $2,338 | $85,220 | $35,090 | $50,130 |
| 2018 | $2,288 | $85,220 | $35,090 | $50,130 |
| 2017 | $2,200 | $85,220 | $35,090 | $50,130 |
| 2016 | $0 | $85,220 | $35,090 | $50,130 |
| 2015 | -- | $85,220 | $35,090 | $50,130 |
| 2014 | -- | $85,220 | $35,090 | $50,130 |
Source: Public Records
Map
Nearby Homes
- 1340 Hamilton St
- 634 N Franklin St
- 987 E Philadelphia St
- 269 N Sherman St
- 652 Windsor St
- 1930 N Sherman St
- 229 N Sherman St
- 847 E Philadelphia St
- 839 E Philadelphia St
- 1049 E Mason Ave
- 737 Wallace St
- 725 Wallace St
- 1508 E Market St
- 1116 E King St
- 68 S Albemarle St
- 959 E King St
- 729 E Clarke Ave
- 108 N Oxford St
- 745 E Market St
- 109 N Oxford St