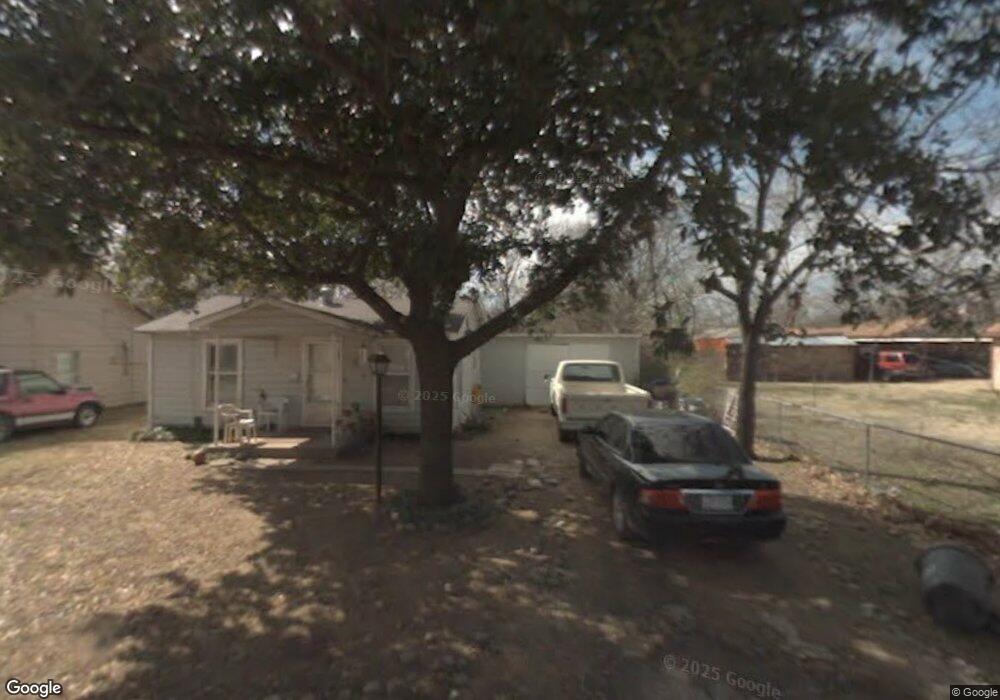
1109 N Walnut St Cleburne, TX 76033
Estimated Value: $166,000 - $184,000
3
Beds
2
Baths
1,100
Sq Ft
$160/Sq Ft
Est. Value
About This Home
This home is located at 1109 N Walnut St, Cleburne, TX 76033 and is currently estimated at $176,455, approximately $160 per square foot. 1109 N Walnut St is a home located in Johnson County with nearby schools including Cooke Elementary School, A.D. Wheat Middle School, and Cleburne High School.
Ownership History
Date
Name
Owned For
Owner Type
Purchase Details
Closed on
Nov 25, 2020
Sold by
Cochran Hillard and Cochran Kathryn
Bought by
Lopez Willberth and Lopez Crystal
Current Estimated Value
Home Financials for this Owner
Home Financials are based on the most recent Mortgage that was taken out on this home.
Original Mortgage
$122,417
Outstanding Balance
$109,182
Interest Rate
2.8%
Mortgage Type
FHA
Estimated Equity
$67,273
Purchase Details
Closed on
Dec 15, 2008
Sold by
Gravitt Linda Belle and Gravitt A H
Bought by
Cochran Hillard and Cochran Kathryn
Home Financials for this Owner
Home Financials are based on the most recent Mortgage that was taken out on this home.
Original Mortgage
$43,350
Interest Rate
6.19%
Mortgage Type
Purchase Money Mortgage
Purchase Details
Closed on
Nov 1, 2007
Sold by
Cashion Pam Elnorene and Pogue Donna Loraine
Bought by
Gravitt Linda Belle
Create a Home Valuation Report for This Property
The Home Valuation Report is an in-depth analysis detailing your home's value as well as a comparison with similar homes in the area
Home Values in the Area
Average Home Value in this Area
Purchase History
| Date | Buyer | Sale Price | Title Company |
|---|---|---|---|
| Lopez Willberth | -- | Capital Title | |
| Cochran Hillard | -- | Rtt | |
| Gravitt Linda Belle | -- | None Available |
Source: Public Records
Mortgage History
| Date | Status | Borrower | Loan Amount |
|---|---|---|---|
| Open | Lopez Willberth | $122,417 | |
| Previous Owner | Cochran Hillard | $43,350 |
Source: Public Records
Tax History Compared to Growth
Tax History
| Year | Tax Paid | Tax Assessment Tax Assessment Total Assessment is a certain percentage of the fair market value that is determined by local assessors to be the total taxable value of land and additions on the property. | Land | Improvement |
|---|---|---|---|---|
| 2025 | $2,919 | $130,908 | $39,000 | $91,908 |
| 2024 | $2,919 | $130,908 | $39,000 | $91,908 |
| 2023 | $2,668 | $119,908 | $28,000 | $91,908 |
| 2022 | $3,001 | $119,908 | $28,000 | $91,908 |
| 2021 | $3,129 | $119,908 | $28,000 | $91,908 |
| 2020 | $1,865 | $67,287 | $20,000 | $47,287 |
| 2019 | $1,988 | $67,287 | $20,000 | $47,287 |
| 2018 | $1,380 | $46,700 | $13,000 | $33,700 |
| 2017 | $1,375 | $46,700 | $13,000 | $33,700 |
| 2016 | $968 | $32,896 | $11,500 | $21,396 |
| 2015 | $689 | $32,896 | $11,500 | $21,396 |
| 2014 | $689 | $25,832 | $11,000 | $14,832 |
Source: Public Records
Map
Nearby Homes
- 704 Graham St
- 1103 N Walnut St
- 701 Poindexter Ave
- 607 N Wood St
- 1204 N Wood St
- 107 Woodard Ave
- 807 Poindexter Ave
- 502 Bales St
- 800 Madison St
- 508 Bales St
- 308 Poindexter Ave
- 922 N Buffalo Ave
- 916 Poindexter Ave
- 702 N Walnut St
- 312 N Wood St
- 418 Marengo St
- 104 Dixon St
- 411 Euclid St
- 709 N Buffalo Ave
- 805 Marengo St
- 1107 N Walnut St
- 703 W Lone Star Ave
- 701 W Lone Star Ave
- 1105 N Walnut St
- 707 W Lone Star Ave
- 1110 Baird St
- 1108 Baird St
- 611 W Lone Star Ave
- 1110 N Walnut St
- 1108 N Walnut St
- 710 Graham St
- 709 W Lone Star Ave
- 1101 N Walnut St
- 608 Graham St
- 704 W Lone Star Ave
- 706 W Lone Star Ave
- 712 Graham St
- 702 W Lone Star Ave
- 614 W Lone Star Ave
- 606 Graham St