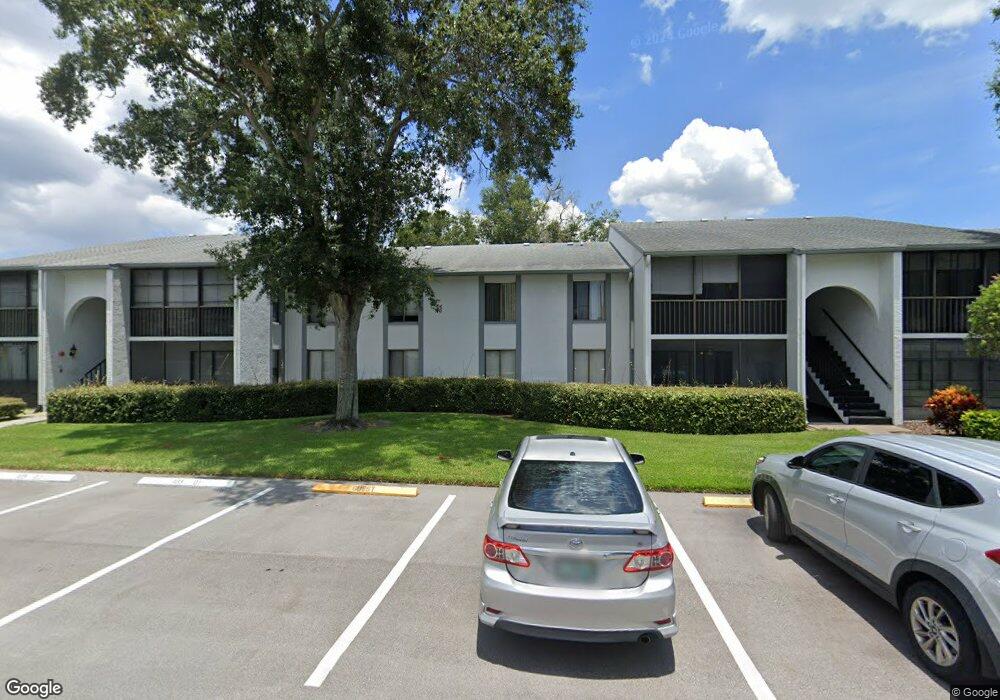
1109 Pine Ridge Cir W Unit E2 Tarpon Springs, FL 34688
Estimated Value: $169,639 - $189,000
2
Beds
2
Baths
1,085
Sq Ft
$167/Sq Ft
Est. Value
About This Home
This home is located at 1109 Pine Ridge Cir W Unit E2, Tarpon Springs, FL 34688 and is currently estimated at $180,660, approximately $166 per square foot. 1109 Pine Ridge Cir W Unit E2 is a home located in Pinellas County with nearby schools including East Lake High School, Cypress Woods Elementary School, and Tarpon Springs Middle School.
Ownership History
Date
Name
Owned For
Owner Type
Purchase Details
Closed on
Sep 30, 2016
Sold by
Mangan Timothy and Mangan Meghan
Bought by
Serdarevic Nebgojsa and Serdarevic Maijana
Current Estimated Value
Home Financials for this Owner
Home Financials are based on the most recent Mortgage that was taken out on this home.
Original Mortgage
$64,720
Outstanding Balance
$29,516
Interest Rate
2.77%
Mortgage Type
New Conventional
Estimated Equity
$151,144
Purchase Details
Closed on
Oct 31, 2003
Sold by
Born Mark T and Born Kathleen M
Bought by
Mangan Timothy and Mangan Meghan
Purchase Details
Closed on
Aug 30, 1996
Sold by
Esposito Benedetto and Esposito Dolores P
Bought by
Born Mark I and Born Kathleen M
Home Financials for this Owner
Home Financials are based on the most recent Mortgage that was taken out on this home.
Original Mortgage
$40,850
Interest Rate
8.2%
Mortgage Type
New Conventional
Create a Home Valuation Report for This Property
The Home Valuation Report is an in-depth analysis detailing your home's value as well as a comparison with similar homes in the area
Home Values in the Area
Average Home Value in this Area
Purchase History
| Date | Buyer | Sale Price | Title Company |
|---|---|---|---|
| Serdarevic Nebgojsa | $80,900 | Republic Land And Title Inc | |
| Mangan Timothy | $82,000 | Pioneer Title Inc | |
| Born Mark I | $43,000 | -- |
Source: Public Records
Mortgage History
| Date | Status | Borrower | Loan Amount |
|---|---|---|---|
| Open | Serdarevic Nebgojsa | $64,720 | |
| Previous Owner | Born Mark I | $40,850 |
Source: Public Records
Tax History Compared to Growth
Tax History
| Year | Tax Paid | Tax Assessment Tax Assessment Total Assessment is a certain percentage of the fair market value that is determined by local assessors to be the total taxable value of land and additions on the property. | Land | Improvement |
|---|---|---|---|---|
| 2024 | $648 | $75,604 | -- | -- |
| 2023 | $648 | $73,402 | $0 | $0 |
| 2022 | $637 | $71,264 | $0 | $0 |
| 2021 | $653 | $69,188 | $0 | $0 |
| 2020 | $656 | $68,233 | $0 | $0 |
| 2019 | $653 | $66,699 | $0 | $0 |
| 2018 | $651 | $65,455 | $0 | $0 |
| 2017 | $653 | $64,109 | $0 | $0 |
| 2016 | $1,193 | $57,282 | $0 | $0 |
| 2015 | $1,056 | $50,752 | $0 | $0 |
| 2014 | $1,063 | $48,152 | $0 | $0 |
Source: Public Records
Map
Nearby Homes
- 1109 Pine Ridge Cir W Unit G1
- 1109 Pine Ridge Cir W Unit C1
- 1225 Pine Ridge Cir W Unit A2
- 1290 Pine Ridge Cir E Unit G1
- 1281 Pine Ridge Cir E Unit B1
- 1207 Pine Ridge Cir W Unit H2
- 1309 Pine Ridge Cir E Unit H3
- 1182 Pine Ridge Cir W Unit B1
- 1344 Pine Ridge Cir E Unit D2
- 1151 Pine Ridge Cir W Unit C1
- 1300 Shady Pine Way Unit B
- 1337 Pine Ridge Cir E Unit D2
- 1333 Shady Pine Way Unit F
- 1354 Shady Pine Way Unit E2
- 1400 Pine Glen Ln Unit D1
- 1400 Pine Glen Ln Unit Bldg 212 D-2
- 3025 Naughton Way
- 1423 Pine Glen Ln Unit D2
- 1441 Pine Glen Ln Unit E2
- 3023 Northfield Dr
- 1109 Pine Ridge Cir W Unit 103A2
- 1109 Pine Ridge Cir W Unit 103F1
- 1109 Pine Ridge Cir W Unit D1
- 1109 Pine Ridge Cir W
- 1109 Pine Ridge Cir W Unit E1
- 1109 Pine Ridge Cir W Unit F1
- 1109 Pine Ridge Cir W Unit H1
- 1109 Pine Ridge Cir W Unit 103G2
- 1109 Pine Ridge Cir W Unit F2
- 1109 Pine Ridge Cir W
- 1109 Pine Ridge Cir W Unit 103E2
- 1109 Pine Ridge Cir W
- 1109 Pine Ridge Cir W Unit D2
- 1109 Pine Ridge Cir W
- 1109 Pine Ridge Cir W Unit C2
- 1109 Pine Ridge Cir W Unit B2
- 1109 Pine Ridge Cir W
- 1109 Pine Ridge Cir W Unit A2
- 1109 Pine Ridge Cir W Unit A1
- 1109 Pine Ridge Cir W Unit H2