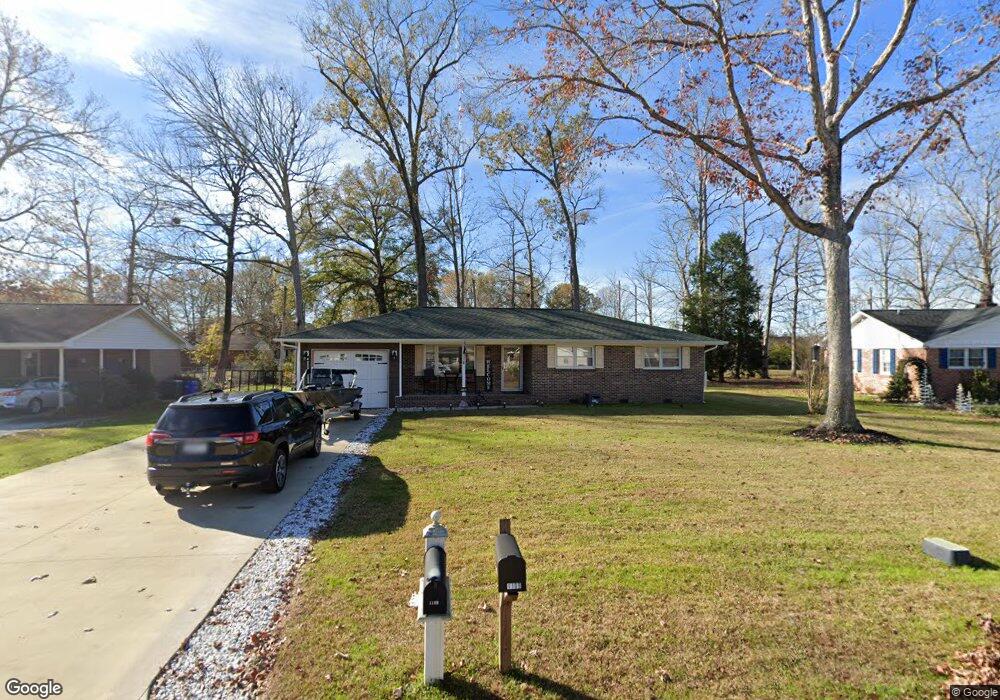
1109 Reta St Conway, SC 29526
Estimated Value: $217,000 - $255,000
3
Beds
2
Baths
1,360
Sq Ft
$169/Sq Ft
Est. Value
About This Home
This home is located at 1109 Reta St, Conway, SC 29526 and is currently estimated at $229,778, approximately $168 per square foot. 1109 Reta St is a home located in Horry County with nearby schools including Homewood Elementary School, Whittemore Park Middle School, and Conway High School.
Ownership History
Date
Name
Owned For
Owner Type
Purchase Details
Closed on
Nov 6, 2017
Sold by
Mathus Steven
Bought by
Mathus Steven and Funderburk Arlene Stewart
Current Estimated Value
Home Financials for this Owner
Home Financials are based on the most recent Mortgage that was taken out on this home.
Original Mortgage
$132,795
Outstanding Balance
$109,940
Interest Rate
3.85%
Mortgage Type
VA
Estimated Equity
$119,838
Purchase Details
Closed on
Dec 17, 2009
Sold by
Buda Stacy Ann
Bought by
Carver Bruce A
Purchase Details
Closed on
Dec 15, 2009
Sold by
Buda Than Jason
Bought by
Buda Stacy Ann
Purchase Details
Closed on
Sep 29, 2005
Sold by
Hirtz Gail R
Bought by
Buda Stacy Ann and Buda Than Jason
Home Financials for this Owner
Home Financials are based on the most recent Mortgage that was taken out on this home.
Original Mortgage
$123,000
Interest Rate
5.66%
Mortgage Type
Construction
Purchase Details
Closed on
Sep 30, 2004
Sold by
Bonneau Woodcock Daryl Jane
Bought by
Hirtz Gail R
Create a Home Valuation Report for This Property
The Home Valuation Report is an in-depth analysis detailing your home's value as well as a comparison with similar homes in the area
Home Values in the Area
Average Home Value in this Area
Purchase History
| Date | Buyer | Sale Price | Title Company |
|---|---|---|---|
| Mathus Steven | $130,000 | -- | |
| Carver Bruce A | $117,000 | -- | |
| Buda Stacy Ann | -- | -- | |
| Buda Stacy Ann | $123,000 | -- | |
| Hirtz Gail R | $99,900 | -- |
Source: Public Records
Mortgage History
| Date | Status | Borrower | Loan Amount |
|---|---|---|---|
| Open | Mathus Steven | $132,795 | |
| Previous Owner | Buda Stacy Ann | $123,000 |
Source: Public Records
Tax History
| Year | Tax Paid | Tax Assessment Tax Assessment Total Assessment is a certain percentage of the fair market value that is determined by local assessors to be the total taxable value of land and additions on the property. | Land | Improvement |
|---|---|---|---|---|
| 2025 | $2,494 | $0 | $0 | $0 |
| 2024 | $2,494 | $11,870 | $3,691 | $8,179 |
| 2023 | $2,468 | $8,053 | $1,513 | $6,540 |
| 2021 | $2,125 | $8,053 | $1,513 | $6,540 |
| 2020 | $2,051 | $8,053 | $1,513 | $6,540 |
| 2019 | $2,051 | $8,053 | $1,513 | $6,540 |
| 2018 | $1,985 | $7,411 | $1,513 | $5,898 |
| 2017 | $230 | $5,377 | $1,513 | $3,864 |
| 2016 | -- | $5,377 | $1,513 | $3,864 |
| 2015 | $230 | $3,585 | $1,009 | $6,762 |
| 2014 | $217 | $5,378 | $1,514 | $3,864 |
Source: Public Records
Map
Nearby Homes
- 2866 Riverboat Way
- 2108 Cultra Rd
- 2424 Main St
- 2839 Riverboat Way
- 2835 Riverboat Way
- 1040 Black Lake Way
- 2827 Riverboat Way
- 2823 Riverboat Way
- 1008 Liriope Ln
- 2811 Riverboat Way
- 2521 Revolutionary Way
- 609 Ivy Glen Dr
- 2608 Riverboat Way
- 2740 Riverboat Way
- 2745 Riverboat Way
- 2718 Riverboat Way
- 2607 Riverboat Way
- 250 Bald Cypress Way
- 1142 Black Lake Way
- 2754 Riverboat Way
- 1109 Reta St Unit Chicora
- 1105 Reta St
- 1115 Reta St
- 1108 Chicora Blvd Unit Chicora
- 1110 Chicora Blvd
- 1108 Reta St
- 1104 Chicora Blvd
- 1110 Reta St
- 1119 Reta St
- 2503 Aaron St
- 1114 Chicora Blvd
- 1104 Reta St
- 2501 Aaron St
- 2505 Reta St
- 2505 Aaron St
- 2506 Reta St
- 1105 E St
- 2507 Reta St
- 1109 Chicora Blvd
- 2504 Aaron St
Your Personal Tour Guide
Ask me questions while you tour the home.