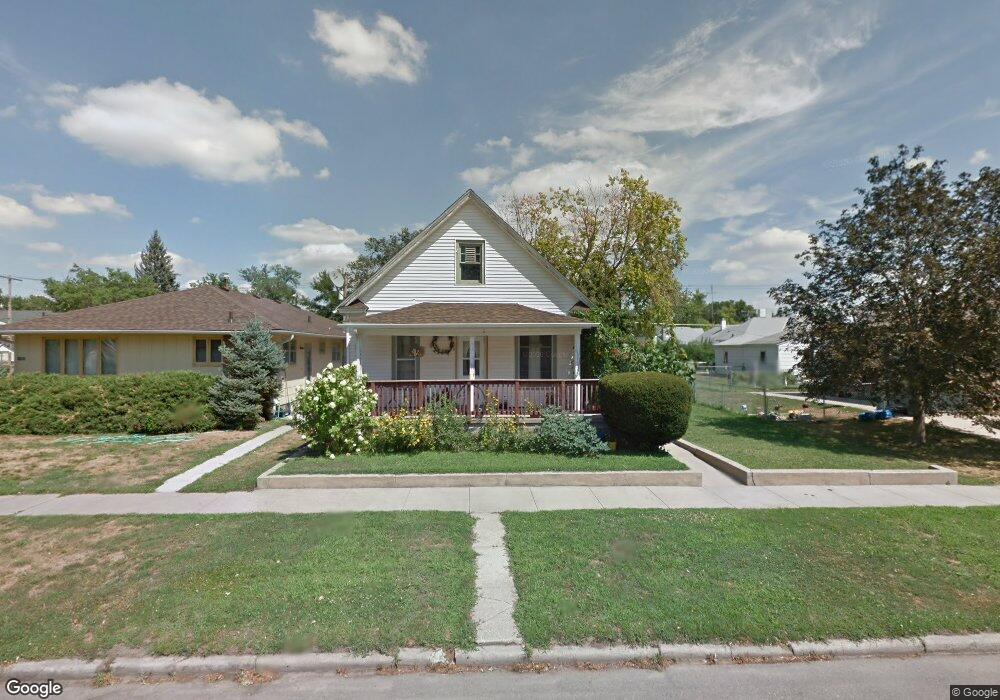
1109 S 4th St Norfolk, NE 68701
Estimated Value: $181,000 - $197,000
3
Beds
1
Bath
1,224
Sq Ft
$154/Sq Ft
Est. Value
About This Home
This home is located at 1109 S 4th St, Norfolk, NE 68701 and is currently estimated at $188,531, approximately $154 per square foot. 1109 S 4th St is a home located in Madison County with nearby schools including Norfolk Senior High School, Christ Lutheran School, and Keystone Christian Academy.
Ownership History
Date
Name
Owned For
Owner Type
Purchase Details
Closed on
Mar 20, 2017
Sold by
Spencer James R
Bought by
Spencer Jenny L
Current Estimated Value
Purchase Details
Closed on
Jul 21, 2006
Sold by
Spencer James R and Spencer James B
Bought by
Spencer James R and Spencer Jenny L
Home Financials for this Owner
Home Financials are based on the most recent Mortgage that was taken out on this home.
Original Mortgage
$65,621
Interest Rate
6.6%
Mortgage Type
Unknown
Purchase Details
Closed on
Mar 21, 2003
Sold by
Dalrymple Brenda L
Bought by
Spencer James R and Spencer James B
Purchase Details
Closed on
Feb 8, 2002
Sold by
Elkhorn Valley Community Dev Corp
Bought by
Dalrymple Brenda L
Purchase Details
Closed on
Dec 4, 2001
Sold by
Secretary Of Housing & Urban Dev
Bought by
Elkhorn Valley Community Dev~Corp
Purchase Details
Closed on
Mar 8, 2001
Sold by
Commercial Federal Mortgage Corp
Bought by
Sec Of Housing & Urban Develop
Create a Home Valuation Report for This Property
The Home Valuation Report is an in-depth analysis detailing your home's value as well as a comparison with similar homes in the area
Home Values in the Area
Average Home Value in this Area
Purchase History
| Date | Buyer | Sale Price | Title Company |
|---|---|---|---|
| Spencer Jenny L | -- | None Available | |
| Spencer James R | -- | -- | |
| Spencer James R | -- | Northeast Neb Title | |
| Spencer James R | $66,400 | -- | |
| Dalrymple Brenda L | $57,450 | -- | |
| Elkhorn Valley Community Dev~Corp | $46,000 | -- | |
| Sec Of Housing & Urban Develop | -- | -- |
Source: Public Records
Mortgage History
| Date | Status | Borrower | Loan Amount |
|---|---|---|---|
| Closed | Spencer James R | $65,621 |
Source: Public Records
Tax History Compared to Growth
Tax History
| Year | Tax Paid | Tax Assessment Tax Assessment Total Assessment is a certain percentage of the fair market value that is determined by local assessors to be the total taxable value of land and additions on the property. | Land | Improvement |
|---|---|---|---|---|
| 2024 | $2,027 | $162,394 | $8,021 | $154,373 |
| 2023 | $2,696 | $145,854 | $8,021 | $137,833 |
| 2022 | $2,430 | $131,086 | $8,021 | $123,065 |
| 2021 | $2,237 | $120,925 | $8,021 | $112,904 |
| 2020 | $2,058 | $111,603 | $8,021 | $103,582 |
| 2019 | $1,920 | $100,505 | $8,021 | $92,484 |
| 2018 | $1,672 | $88,992 | $6,417 | $82,575 |
| 2017 | $1,507 | $80,145 | $6,417 | $73,728 |
| 2016 | $1,398 | $74,209 | $5,942 | $68,267 |
| 2015 | $1,399 | $74,209 | $5,942 | $68,267 |
| 2014 | $1,377 | $70,958 | $5,942 | $65,016 |
| 2013 | $1,337 | $66,705 | $5,942 | $60,763 |
Source: Public Records
Map
Nearby Homes
- 1104 S 2nd St
- 410 W Michigan Ave
- 1303 S 3rd St
- 922 S 2nd St
- 918 S 5th St
- 906 S 4th St
- 1406 S 2nd St
- 1405 S 2nd St
- 805 S 5th St
- 809 S 1st St
- 700 S 2nd St
- 603 S 4th St
- 705 S 10th St
- 804 Volkman Dr
- 602 S 10th St
- 3306 W Michigan Ave
- 3206 W Michigan Ave
- 3205 W Michigan Ave
- 3307 W Michigan Ave
- 606 S Boxelder St
- 1107 S 4th St
- 1111 S 4th St
- 316 W Indiana Ave
- 1105 S 4th St
- 318 W Indiana Ave
- 312 W Indiana Ave
- 1103 S 4th St
- 310 W Indiana Ave
- 313 W Prairie Ave
- 1101 S 4th St
- 308 W Indiana Ave
- 311 W Prairie Ave
- 1201 S 4th St
- 1201 S 4th St Unit 313 Indiana
- 1108 S 4th St
- 1106 S 4th St
- 1110 S 4th St
- 309 W Prairie Ave
- 1100 S 4th St
- 1104 S 4th St