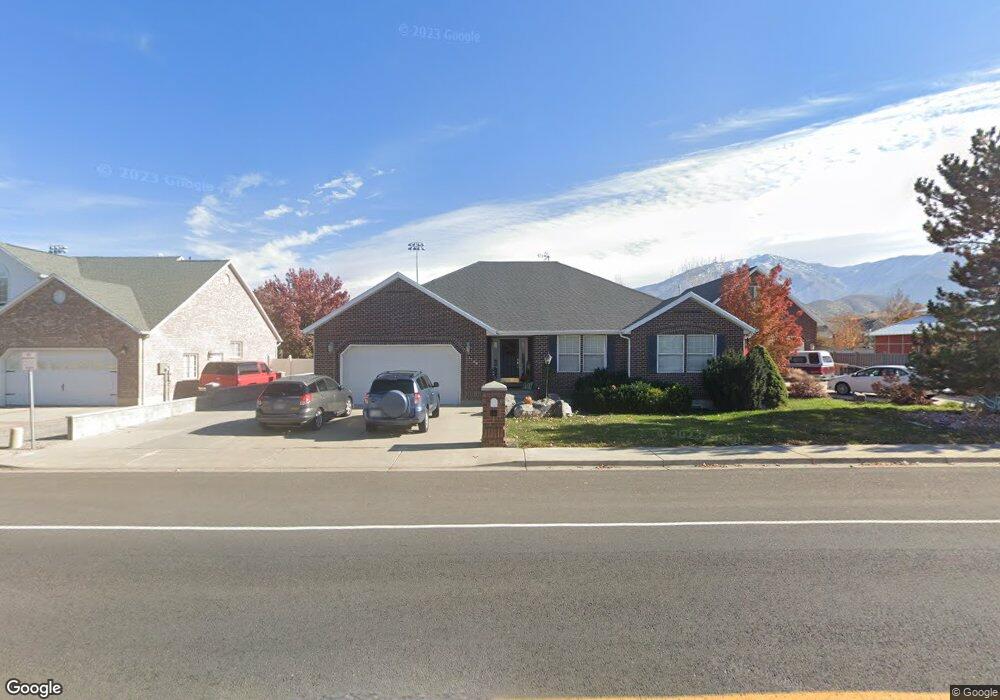
1109 S Main St Payson, UT 84651
Estimated Value: $633,000 - $918,000
4
Beds
4
Baths
3,852
Sq Ft
$194/Sq Ft
Est. Value
About This Home
This home is located at 1109 S Main St, Payson, UT 84651 and is currently estimated at $749,094, approximately $194 per square foot. 1109 S Main St is a home located in Utah County with nearby schools including Park View Elementary, Payson High School, and Payson Junior High School.
Ownership History
Date
Name
Owned For
Owner Type
Purchase Details
Closed on
Feb 27, 2020
Sold by
Hartley Michael Ardell and Hartley Danene
Bought by
Hartley Michael Ardell and Hartley Danene
Current Estimated Value
Home Financials for this Owner
Home Financials are based on the most recent Mortgage that was taken out on this home.
Original Mortgage
$60,000
Outstanding Balance
$53,239
Interest Rate
3.6%
Mortgage Type
Credit Line Revolving
Estimated Equity
$695,855
Purchase Details
Closed on
Aug 2, 2019
Sold by
Hartley Michael and Hartley Danene
Bought by
Hartley Michael Ardell and Hartley Danene
Purchase Details
Closed on
Oct 27, 2017
Sold by
Davis Jason E and Davis Candice N
Bought by
Hartley Michael and Hartley Danene
Home Financials for this Owner
Home Financials are based on the most recent Mortgage that was taken out on this home.
Original Mortgage
$375,250
Outstanding Balance
$314,275
Interest Rate
3.83%
Mortgage Type
New Conventional
Estimated Equity
$434,819
Purchase Details
Closed on
Jun 27, 2014
Sold by
Charles David S and Charles Michelle B
Bought by
Davis Jason E and Davis Candice N
Home Financials for this Owner
Home Financials are based on the most recent Mortgage that was taken out on this home.
Original Mortgage
$135,000
Interest Rate
4.07%
Mortgage Type
New Conventional
Purchase Details
Closed on
Sep 25, 2001
Sold by
Charles David Stuart and Charles Michelle Bowen
Bought by
Charles Ii David Stuart
Home Financials for this Owner
Home Financials are based on the most recent Mortgage that was taken out on this home.
Original Mortgage
$137,500
Interest Rate
6.91%
Purchase Details
Closed on
Aug 9, 1999
Sold by
Charles David S and Charles Michelle S
Bought by
Charles Ii David Stuart and Charles Michelle Bowen
Home Financials for this Owner
Home Financials are based on the most recent Mortgage that was taken out on this home.
Original Mortgage
$136,800
Interest Rate
7.7%
Mortgage Type
Stand Alone First
Create a Home Valuation Report for This Property
The Home Valuation Report is an in-depth analysis detailing your home's value as well as a comparison with similar homes in the area
Home Values in the Area
Average Home Value in this Area
Purchase History
| Date | Buyer | Sale Price | Title Company |
|---|---|---|---|
| Hartley Michael Ardell | -- | Meridian Title Company | |
| Hartley Michael Ardell | -- | Meridian Title Company | |
| Hartley Michael Ardell | -- | Pro Land Title Co | |
| Hartley Michael | -- | Gt Title Services | |
| Davis Jason E | -- | North American Title | |
| Charles Ii David Stuart | -- | First American Title Insuran | |
| Charles Ii David Stuart | -- | Summit Title Insurance Agenc | |
| Charles Ii David S | -- | Summit Title Co |
Source: Public Records
Mortgage History
| Date | Status | Borrower | Loan Amount |
|---|---|---|---|
| Open | Hartley Michael Ardell | $60,000 | |
| Open | Hartley Michael | $375,250 | |
| Previous Owner | Davis Jason E | $135,000 | |
| Previous Owner | Charles Ii David Stuart | $137,500 | |
| Previous Owner | Charles Ii David Stuart | $136,800 |
Source: Public Records
Tax History
| Year | Tax Paid | Tax Assessment Tax Assessment Total Assessment is a certain percentage of the fair market value that is determined by local assessors to be the total taxable value of land and additions on the property. | Land | Improvement |
|---|---|---|---|---|
| 2025 | $3,521 | $396,385 | -- | -- |
| 2024 | $3,521 | $358,325 | $0 | $0 |
| 2023 | $3,644 | $371,910 | $0 | $0 |
| 2022 | $3,476 | $348,865 | $0 | $0 |
| 2021 | $2,956 | $475,800 | $122,000 | $353,800 |
| 2020 | $2,808 | $442,200 | $110,900 | $331,300 |
| 2019 | $2,620 | $423,100 | $91,800 | $331,300 |
| 2018 | $2,400 | $373,500 | $80,300 | $293,200 |
| 2017 | $2,184 | $182,820 | $0 | $0 |
| 2016 | $2,148 | $178,585 | $0 | $0 |
| 2015 | $1,886 | $155,760 | $0 | $0 |
| 2014 | $1,822 | $151,580 | $0 | $0 |
Source: Public Records
Map
Nearby Homes
- 288 E 900 S
- 876 Greenridge Ave
- 389 E 1290 S
- 336 E 1330 S
- 1463 S 260 W
- 252 E 670 S Unit 2
- 229 E 670 S Unit 7
- 420 E 600 S
- 549 S Main St
- 609 W Saddlebrook Dr
- 613 W Saddlebrook Dr
- 1836 S 100 E
- 1172 S 880 W
- 802 Brookside Ct
- 245 W 1770 S
- 991 S 930 W
- 846 S 880 W
- 533 S 700 W
- 1631 S Highway 198
- 626 S 800 W Unit 32
Your Personal Tour Guide
Ask me questions while you tour the home.