Estimated Value: $136,000 - $153,971
3
Beds
1
Bath
792
Sq Ft
$185/Sq Ft
Est. Value
About This Home
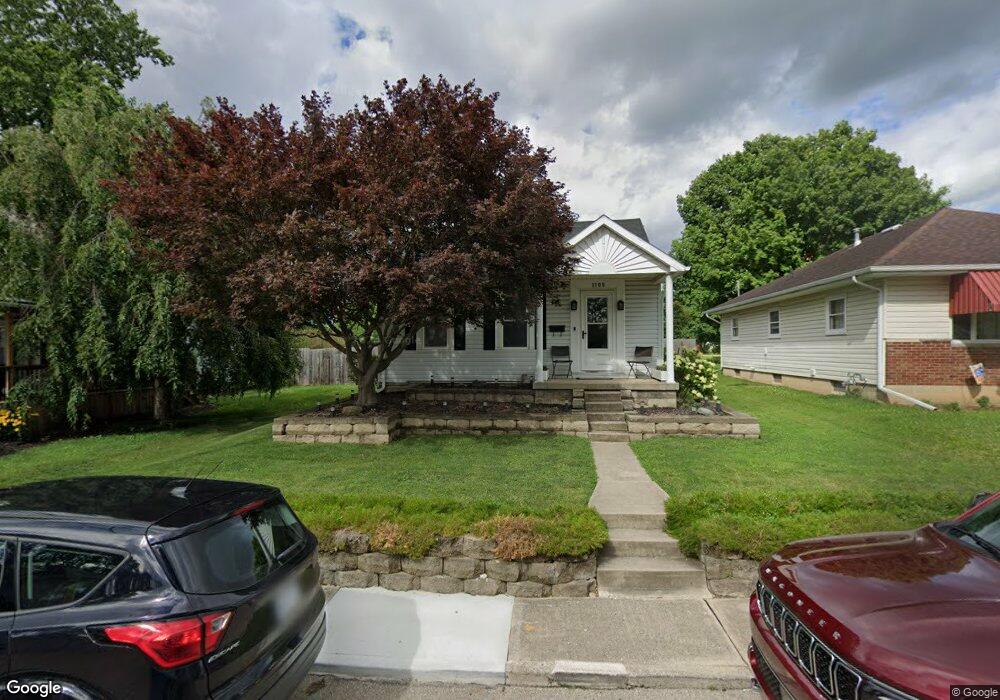
This home is located at 1109 Scudder St, Piqua, OH 45356 and is currently estimated at $146,743, approximately $185 per square foot. 1109 Scudder St is a home located in Miami County with nearby schools including Piqua Central Intermediate School, Springcreek Primary School, and Piqua Junior High School.
Ownership History
Date
Name
Owned For
Owner Type
Purchase Details
Closed on
Feb 27, 2023
Sold by
Copeland Christine and Copeland Jeffrey
Bought by
Copeland Jeffrey and Copeland Christine
Current Estimated Value
Purchase Details
Closed on
Jul 15, 2021
Sold by
Copeland Christine and Copeland Jeffrey
Bought by
Copeland Jerrrey and Copeland Christine
Home Financials for this Owner
Home Financials are based on the most recent Mortgage that was taken out on this home.
Original Mortgage
$78,780
Interest Rate
2.1%
Mortgage Type
New Conventional
Purchase Details
Closed on
Nov 5, 2012
Sold by
Copeland Christine and Copeland Jeffrey
Bought by
Copeland Christine
Home Financials for this Owner
Home Financials are based on the most recent Mortgage that was taken out on this home.
Original Mortgage
$59,100
Interest Rate
3.38%
Mortgage Type
New Conventional
Purchase Details
Closed on
Jul 23, 2007
Sold by
Cooper Gary Lee
Bought by
Cooper Christine
Purchase Details
Closed on
Apr 1, 1980
Bought by
Cooper Gary Lee
Create a Home Valuation Report for This Property
The Home Valuation Report is an in-depth analysis detailing your home's value as well as a comparison with similar homes in the area
Home Values in the Area
Average Home Value in this Area
Purchase History
| Date | Buyer | Sale Price | Title Company |
|---|---|---|---|
| Copeland Jeffrey | -- | -- | |
| Copeland Jerrrey | -- | Accommodation | |
| Copeland Christine | -- | Servicelink | |
| Cooper Christine | -- | -- | |
| Cooper Gary Lee | $40,000 | -- |
Source: Public Records
Mortgage History
| Date | Status | Borrower | Loan Amount |
|---|---|---|---|
| Previous Owner | Copeland Jerrrey | $78,780 | |
| Previous Owner | Copeland Christine | $59,100 |
Source: Public Records
Tax History Compared to Growth
Tax History
| Year | Tax Paid | Tax Assessment Tax Assessment Total Assessment is a certain percentage of the fair market value that is determined by local assessors to be the total taxable value of land and additions on the property. | Land | Improvement |
|---|---|---|---|---|
| 2024 | $1,428 | $34,760 | $9,450 | $25,310 |
| 2023 | $1,428 | $34,760 | $9,450 | $25,310 |
| 2022 | $1,453 | $34,760 | $9,450 | $25,310 |
| 2021 | $1,223 | $26,740 | $7,280 | $19,460 |
| 2020 | $1,198 | $26,740 | $7,280 | $19,460 |
| 2019 | $1,205 | $26,740 | $7,280 | $19,460 |
| 2018 | $1,153 | $24,430 | $7,560 | $16,870 |
| 2017 | $1,167 | $24,430 | $7,560 | $16,870 |
| 2016 | $1,154 | $24,430 | $7,560 | $16,870 |
| 2015 | $1,135 | $23,490 | $7,280 | $16,210 |
| 2014 | $1,135 | $23,490 | $7,280 | $16,210 |
| 2013 | $1,139 | $23,490 | $7,280 | $16,210 |
Source: Public Records
Map
Nearby Homes