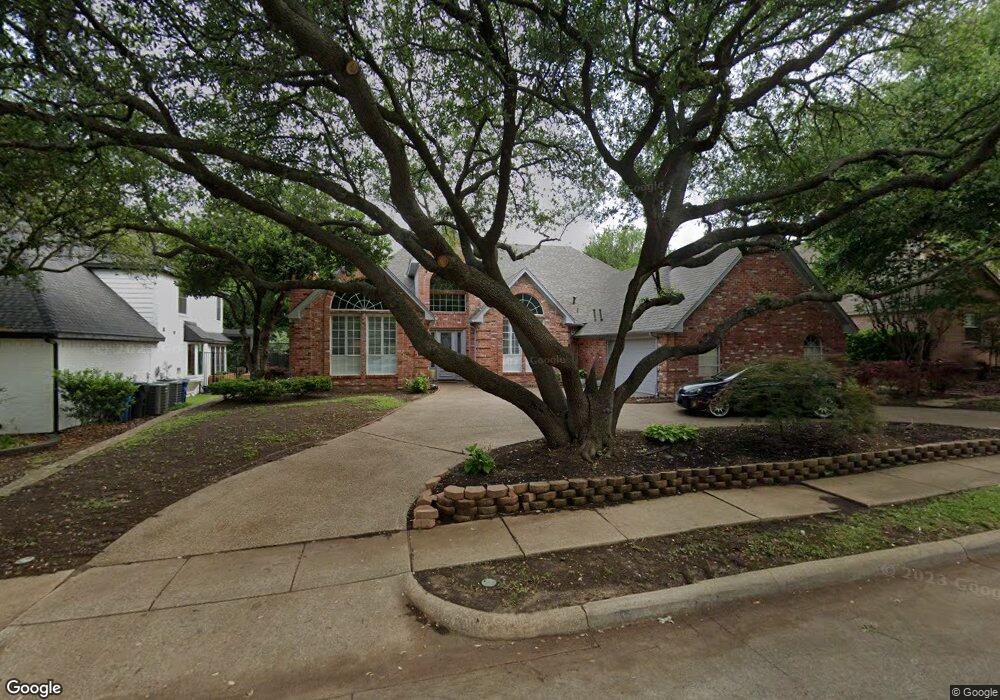
1109 Shadetree Ln Allen, TX 75013
Twin Creeks NeighborhoodEstimated Value: $676,000 - $885,000
4
Beds
4
Baths
3,065
Sq Ft
$243/Sq Ft
Est. Value
About This Home
This home is located at 1109 Shadetree Ln, Allen, TX 75013 and is currently estimated at $743,501, approximately $242 per square foot. 1109 Shadetree Ln is a home located in Collin County with nearby schools including Dr. E.T. Boon Elementary School, Ereckson Middle School, and Lowery Freshman Center.
Ownership History
Date
Name
Owned For
Owner Type
Purchase Details
Closed on
Sep 4, 2015
Sold by
Barnett William C and Barnett Kathy D
Bought by
Norton Celia Paige
Current Estimated Value
Home Financials for this Owner
Home Financials are based on the most recent Mortgage that was taken out on this home.
Original Mortgage
$352,750
Outstanding Balance
$278,660
Interest Rate
4.08%
Mortgage Type
New Conventional
Estimated Equity
$464,841
Purchase Details
Closed on
Jul 21, 2006
Sold by
Weidner Ryan L
Bought by
Barnett William C and Barnett Kathy D
Home Financials for this Owner
Home Financials are based on the most recent Mortgage that was taken out on this home.
Original Mortgage
$290,000
Interest Rate
6.6%
Mortgage Type
Purchase Money Mortgage
Purchase Details
Closed on
Feb 27, 2006
Sold by
Weidner Timothy L and Weidner Darlene S
Bought by
Weidner Ryan Lee
Create a Home Valuation Report for This Property
The Home Valuation Report is an in-depth analysis detailing your home's value as well as a comparison with similar homes in the area
Home Values in the Area
Average Home Value in this Area
Purchase History
| Date | Buyer | Sale Price | Title Company |
|---|---|---|---|
| Norton Celia Paige | -- | Fatco | |
| Barnett William C | -- | Ctic | |
| Weidner Ryan Lee | -- | None Available |
Source: Public Records
Mortgage History
| Date | Status | Borrower | Loan Amount |
|---|---|---|---|
| Open | Norton Celia Paige | $352,750 | |
| Previous Owner | Barnett William C | $290,000 |
Source: Public Records
Tax History Compared to Growth
Tax History
| Year | Tax Paid | Tax Assessment Tax Assessment Total Assessment is a certain percentage of the fair market value that is determined by local assessors to be the total taxable value of land and additions on the property. | Land | Improvement |
|---|---|---|---|---|
| 2025 | $9,735 | $692,130 | $224,250 | $495,363 |
| 2024 | $9,735 | $629,209 | $207,000 | $466,867 |
| 2023 | $9,735 | $572,008 | $172,500 | $506,342 |
| 2022 | $12,662 | $637,821 | $151,800 | $486,021 |
| 2021 | $10,051 | $472,734 | $131,100 | $341,634 |
| 2020 | $9,908 | $449,515 | $117,300 | $332,215 |
| 2019 | $10,563 | $457,267 | $117,300 | $339,967 |
| 2018 | $10,408 | $442,511 | $122,400 | $320,111 |
| 2017 | $9,874 | $419,794 | $122,400 | $297,394 |
| 2016 | $9,943 | $414,373 | $108,000 | $306,373 |
| 2015 | $8,794 | $354,887 | $93,600 | $261,287 |
| 2014 | $8,794 | $363,755 | $0 | $0 |
Source: Public Records
Map
Nearby Homes
- 1123 Shadetree Ln
- 1210 Edgewood Ln
- 321 Phoebe Dr
- 112 Brentwood Ct
- 1101 Fairfax Dr
- 604 Pilot Point Dr
- 1038 Audrey Way
- 1029 Audrey Way
- 1017 Lucy Ln
- 1013 Taylor Dr
- 1013 Lucy Ln
- 1205 Sonoma Dr
- 505 Cutter Ln
- 1212 Cordova Dr
- 1208 Granger Dr
- 102 Fontana Ct
- 812 Davids Way
- 1400 Cool Springs Dr
- 1010 Alameda Ct
- 811 Otto Dr
- 1107 Shadetree Ln
- 1111 Shadetree Ln
- 1105 Shadetree Ln
- 1113 Shadetree Ln
- 1108 Rainforest Ln
- 1110 Shadetree Ln
- 1106 Rainforest Ln
- 1108 Shadetree Ln
- 1110 Rainforest Ln
- 1104 Rainforest Ln
- 1106 Shadetree Ln
- 1112 Shadetree Ln
- 1103 Shadetree Ln
- 1102 Rainforest Ln
- 1112 Rainforest Ln
- 1115 Shadetree Ln
- 1100 Rainforest Ln
- 1114 Rainforest Ln
- 1114 Shadetree Ln
- 1102 Shadetree Ln