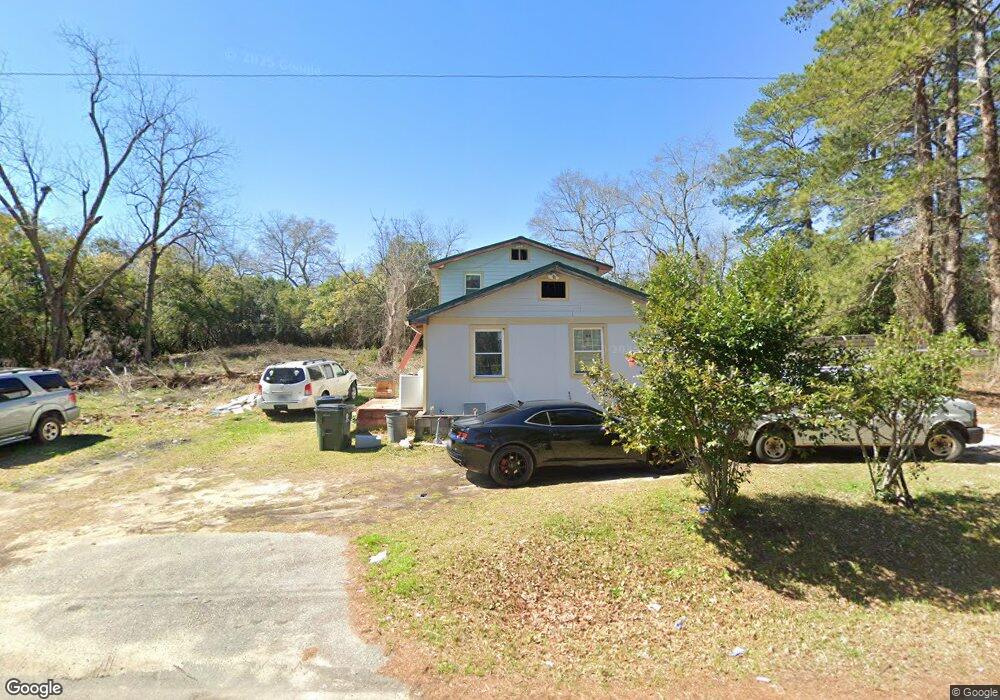
1109 Southern Ave Warner Robins, GA 31093
Estimated Value: $114,000 - $142,000
--
Bed
2
Baths
1,632
Sq Ft
$78/Sq Ft
Est. Value
About This Home
This home is located at 1109 Southern Ave, Warner Robins, GA 31093 and is currently estimated at $127,662, approximately $78 per square foot. 1109 Southern Ave is a home located in Houston County with nearby schools including Huntington Middle School, Warner Robins High School, and Christian Fellowship Academy.
Ownership History
Date
Name
Owned For
Owner Type
Purchase Details
Closed on
Dec 29, 2016
Sold by
Keene Barbara
Bought by
Bernabe Lidia
Current Estimated Value
Purchase Details
Closed on
Oct 9, 2001
Sold by
Keene Barbara A
Bought by
Hoffman Juanita K
Purchase Details
Closed on
Feb 8, 2001
Sold by
Robins Federal Credit Union
Bought by
Keene Barbara A
Purchase Details
Closed on
Apr 6, 1999
Sold by
Baugh Jimmy K
Bought by
Robins Federal Credit Union
Purchase Details
Closed on
Jan 27, 1998
Sold by
Baugh Jimmy K
Bought by
Baugh Jimmy K
Purchase Details
Closed on
Apr 18, 1996
Sold by
Baugh Jimmy K and Baugh Jimmy L
Bought by
Baugh Jimmy K
Purchase Details
Closed on
Dec 16, 1992
Sold by
Baugh Jimmy K
Bought by
Baugh Jimmy K and Baugh Jimmy L
Purchase Details
Closed on
May 20, 1991
Sold by
Baugh Jimmy
Bought by
Baugh Jimmy K
Purchase Details
Closed on
Jan 1, 1955
Bought by
J Baugh W and J L
Create a Home Valuation Report for This Property
The Home Valuation Report is an in-depth analysis detailing your home's value as well as a comparison with similar homes in the area
Home Values in the Area
Average Home Value in this Area
Purchase History
| Date | Buyer | Sale Price | Title Company |
|---|---|---|---|
| Bernabe Lidia | $9,000 | -- | |
| Hoffman Juanita K | -- | -- | |
| Keene Barbara A | -- | -- | |
| Robins Federal Credit Union | -- | -- | |
| Baugh Jimmy K | -- | -- | |
| Baugh Jimmy K | -- | -- | |
| Baugh Jimmy K | -- | -- | |
| Baugh Jimmy K | -- | -- | |
| Baugh Jimmy | -- | -- | |
| J Baugh W | -- | -- |
Source: Public Records
Tax History Compared to Growth
Tax History
| Year | Tax Paid | Tax Assessment Tax Assessment Total Assessment is a certain percentage of the fair market value that is determined by local assessors to be the total taxable value of land and additions on the property. | Land | Improvement |
|---|---|---|---|---|
| 2024 | $537 | $16,400 | $1,200 | $15,200 |
| 2023 | $216 | $6,560 | $1,080 | $5,480 |
| 2022 | $139 | $6,040 | $1,080 | $4,960 |
| 2021 | $39 | $1,680 | $1,080 | $600 |
| 2020 | $69 | $2,960 | $1,080 | $1,880 |
| 2019 | $86 | $3,680 | $1,080 | $2,600 |
| 2018 | $85 | $3,680 | $1,080 | $2,600 |
| 2017 | $84 | $13,520 | $1,080 | $12,440 |
| 2016 | $437 | $13,520 | $1,080 | $12,440 |
| 2015 | -- | $13,520 | $1,080 | $12,440 |
| 2014 | -- | $18,600 | $1,080 | $17,520 |
| 2013 | -- | $18,600 | $1,080 | $17,520 |
Source: Public Records
Map
Nearby Homes
- 1107 Southern Ave
- 1108 Southern Ave
- 1203 Southern Ave
- 113 Robert St
- 910 N Davis Dr
- 116 Shi St
- 400 Shi St
- 1200 Southern Ave
- 114 Shi St
- 904 N Davis Dr
- 107 Robert St
- 0 Roberts St
- 111 Bargain Rd
- 0 Shi St Unit 7166281
- 0 Shi St Unit 7124716
- 0 Shi St
- 106 Robert St
- 106 Roberts St
- 1009 Southern St
- 918 N Davis Dr