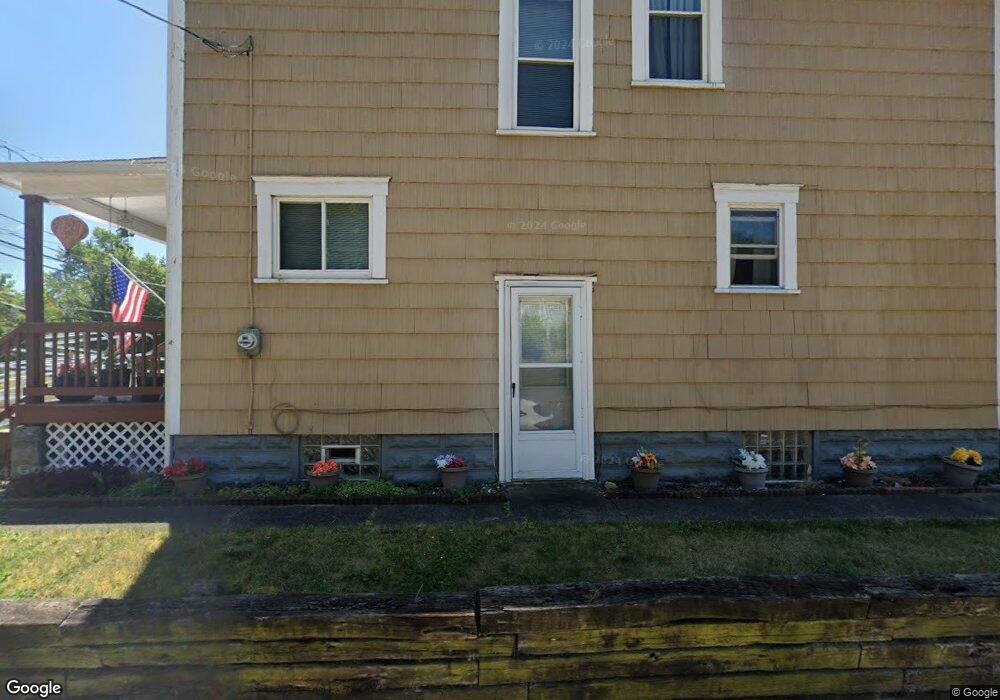
1109 Spring Ave NE Canton, OH 44704
Crystal Park NeighborhoodEstimated Value: $44,000 - $80,000
4
Beds
1
Bath
1,560
Sq Ft
$41/Sq Ft
Est. Value
About This Home
This home is located at 1109 Spring Ave NE, Canton, OH 44704 and is currently estimated at $63,728, approximately $40 per square foot. 1109 Spring Ave NE is a home located in Stark County with nearby schools including Early Learning Center @ Schreiber, Gibbs Elementary School, and Youtz Intermediate School.
Ownership History
Date
Name
Owned For
Owner Type
Purchase Details
Closed on
Aug 16, 2019
Sold by
Williams Deborah
Bought by
Minor Robin A
Current Estimated Value
Purchase Details
Closed on
Jun 11, 2012
Sold by
Prml Llc
Bought by
Williams Deborah
Purchase Details
Closed on
May 20, 2010
Sold by
Prml Llc
Bought by
Williams Deborah S
Home Financials for this Owner
Home Financials are based on the most recent Mortgage that was taken out on this home.
Original Mortgage
$20,000
Interest Rate
4%
Mortgage Type
Seller Take Back
Purchase Details
Closed on
Mar 9, 2010
Sold by
Blankenship Robert D
Bought by
Prml Llc
Purchase Details
Closed on
Mar 3, 2010
Sold by
Schoeneman Louis W and Schoeneman Earl E
Bought by
Blankenship Robert D
Purchase Details
Closed on
Mar 17, 2009
Sold by
Estate Of Arlene F Schoeneman
Bought by
Schoeneman Earl E
Create a Home Valuation Report for This Property
The Home Valuation Report is an in-depth analysis detailing your home's value as well as a comparison with similar homes in the area
Home Values in the Area
Average Home Value in this Area
Purchase History
| Date | Buyer | Sale Price | Title Company |
|---|---|---|---|
| Minor Robin A | $24,900 | None Available | |
| Williams Deborah | $5,000 | None Available | |
| Williams Deborah S | $20,000 | None Available | |
| Prml Llc | $11,500 | None Available | |
| Blankenship Robert D | $11,500 | None Available | |
| Schoeneman Earl E | -- | None Available |
Source: Public Records
Mortgage History
| Date | Status | Borrower | Loan Amount |
|---|---|---|---|
| Previous Owner | Williams Deborah S | $20,000 |
Source: Public Records
Tax History
| Year | Tax Paid | Tax Assessment Tax Assessment Total Assessment is a certain percentage of the fair market value that is determined by local assessors to be the total taxable value of land and additions on the property. | Land | Improvement |
|---|---|---|---|---|
| 2025 | -- | $24,080 | $1,470 | $22,610 |
| 2024 | -- | $24,080 | $1,470 | $22,610 |
| 2023 | $627 | $10,260 | $1,510 | $8,750 |
| 2022 | $613 | $10,260 | $1,510 | $8,750 |
| 2021 | $619 | $10,260 | $1,510 | $8,750 |
| 2020 | $634 | $9,420 | $1,400 | $8,020 |
| 2019 | $44 | $9,420 | $1,400 | $8,020 |
Source: Public Records
Map
Nearby Homes
- 602 11th St NE
- 1024 Rex Ave NE
- 822 Highland Rd NE
- 1014 9th St NE
- 1003 Sherlock Place NE
- 601 Melrose Place NE
- 1322 Struble Ave NE
- 603 15th St NE
- 211 15th St NE
- 1421 Market Ave N
- 1226 Shriver Ave NE
- 1411 Laiblin Place NE
- 1007 Dewalt Ave NW
- 1005 Dewalt Ave NW
- 912 Essig Ct NW
- 1317 Saint Elmo Ave NE
- 1521 Gibbs Ave NE
- 907 16th St NE
- 1622 Spring Ave NE
- 1629 Gibbs Ave NE
- 1103 Spring Ave NE
- 1115 NE Spring Ne Ave
- 1115 Spring Ave NE
- 610 11th St NE
- 1101 Spring Ave NE
- 1121 Spring Ave NE
- 609 11th St NE
- 604 11th St NE
- 1104 Spring Ave NE
- 1116 Spring Ave NE
- 1116 Spring Ave NE
- 1112 Spring Ave NE
- 1108 Spring Ave NE
- 1043 Spring Ave NE
- 1046 Spring Ave NE
- 600 11th St NE
- 709 Highland Rd NE
- 1041 Spring Ave NE
- 710 Highland Rd NE
- 1135 Spring Ave NE
Your Personal Tour Guide
Ask me questions while you tour the home.