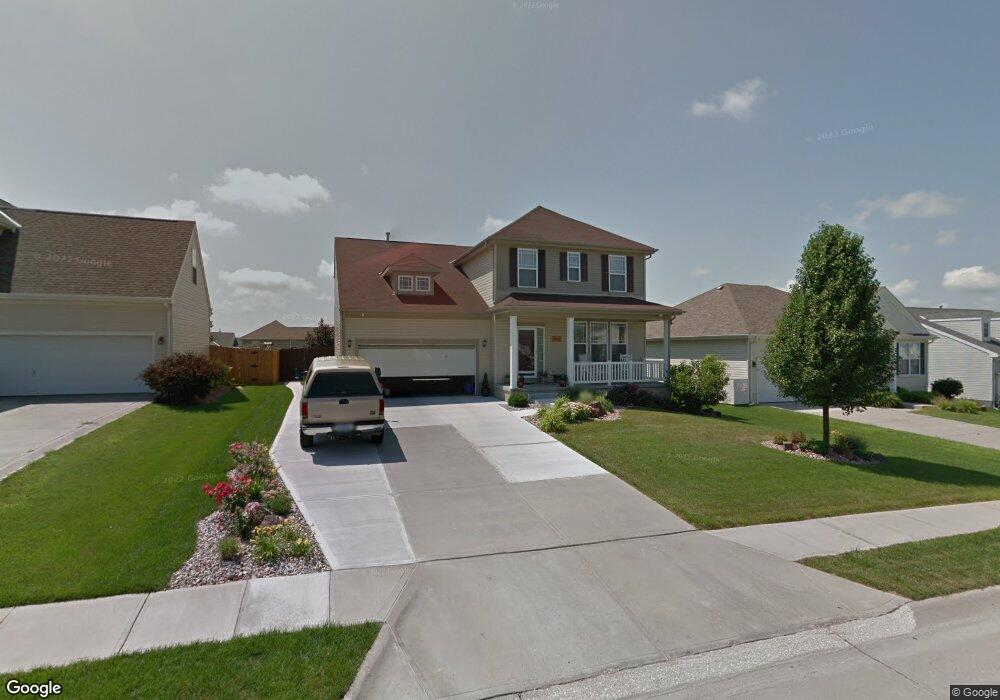
1109 Stony Point Dr Papillion, NE 68046
Estimated Value: $379,209 - $413,000
4
Beds
3
Baths
2,530
Sq Ft
$157/Sq Ft
Est. Value
About This Home
This home is located at 1109 Stony Point Dr, Papillion, NE 68046 and is currently estimated at $396,302, approximately $156 per square foot. 1109 Stony Point Dr is a home located in Sarpy County with nearby schools including Patriot Elementary School, Liberty Middle School, and Papillion La Vista South High School.
Ownership History
Date
Name
Owned For
Owner Type
Purchase Details
Closed on
Jan 24, 2019
Sold by
Ray Alfred
Bought by
Binderim Rayell I and Ray Rayell I
Current Estimated Value
Purchase Details
Closed on
Jul 21, 2008
Sold by
Nelson Chad A and Nelson Ember L
Bought by
Ray Alfred D and Ray Rayell Ilene
Home Financials for this Owner
Home Financials are based on the most recent Mortgage that was taken out on this home.
Original Mortgage
$219,520
Outstanding Balance
$143,969
Interest Rate
6.4%
Estimated Equity
$252,333
Purchase Details
Closed on
Aug 5, 2004
Sold by
Heartstone Homes Inc
Bought by
Nelson Chad A and Nelson Ember L
Home Financials for this Owner
Home Financials are based on the most recent Mortgage that was taken out on this home.
Original Mortgage
$146,700
Interest Rate
6.18%
Create a Home Valuation Report for This Property
The Home Valuation Report is an in-depth analysis detailing your home's value as well as a comparison with similar homes in the area
Home Values in the Area
Average Home Value in this Area
Purchase History
| Date | Buyer | Sale Price | Title Company |
|---|---|---|---|
| Binderim Rayell I | -- | None Available | |
| Ray Alfred D | $215,000 | Nlta | |
| Nelson Chad A | $184,000 | -- |
Source: Public Records
Mortgage History
| Date | Status | Borrower | Loan Amount |
|---|---|---|---|
| Open | Ray Alfred D | $219,520 | |
| Previous Owner | Nelson Chad A | $146,700 | |
| Closed | Nelson Chad A | $18,200 |
Source: Public Records
Tax History Compared to Growth
Tax History
| Year | Tax Paid | Tax Assessment Tax Assessment Total Assessment is a certain percentage of the fair market value that is determined by local assessors to be the total taxable value of land and additions on the property. | Land | Improvement |
|---|---|---|---|---|
| 2025 | $5,992 | $353,014 | $54,000 | $299,014 |
| 2024 | $6,614 | $345,882 | $50,000 | $295,882 |
| 2023 | $6,614 | $316,543 | $47,000 | $269,543 |
| 2022 | $6,438 | $282,488 | $42,000 | $240,488 |
| 2021 | $6,052 | $258,756 | $39,000 | $219,756 |
| 2020 | $5,831 | $249,689 | $36,000 | $213,689 |
| 2019 | $5,601 | $242,377 | $34,000 | $208,377 |
| 2018 | $5,495 | $234,981 | $32,000 | $202,981 |
| 2017 | $5,297 | $226,741 | $32,000 | $194,741 |
| 2016 | $5,120 | $217,127 | $25,000 | $192,127 |
| 2015 | $5,128 | $210,586 | $25,000 | $185,586 |
| 2014 | $4,892 | $200,248 | $25,000 | $175,248 |
| 2012 | -- | $196,451 | $25,000 | $171,451 |
Source: Public Records
Map
Nearby Homes
- 2105 Petersen Dr
- 2006 Diane St
- 2010 Ridgeview Dr
- 2404 Walnut Creek Dr
- 2110 S Mineral Dr
- 2231 Crystal Creek Dr
- 2070 Stillwater Dr
- 12001 S 90th St
- 1806 Walnut Creek Dr
- 1808 Southview Dr
- 812 Lake Tahoe Dr
- 2241 Glacier Dr
- Lot 115 Ave Unit Lot 115
- 814 Clearwater Dr
- 8904 Legacy St
- 2421 Sand Hills Dr
- 8810 Legacy St
- 8811 Legacy St
- 1704 Southview Dr
- 12318 S 89th Ave Unit Lot 118
- 1107 Stony Point Dr
- 1111 Stony Point Dr
- 1105 Stony Point Dr
- 1113 Stony Point Dr
- 2209 Diane St
- 1108 Summit Ridge Dr
- 1110 Summit Ridge Dr
- 1106 Summit Ridge Dr
- 1103 Stony Point Dr
- 1115 Stony Point Dr
- 1106 Stony Point Dr
- 2207 Diane St
- 1114 Summit Ridge Dr
- 1104 Summit Ridge Dr
- 1104 Stony Point Dr
- 2210 Diane St
- 1117 Stony Point Dr
- 1101 Stony Point Dr
- 1116 Summit Ridge Dr
- 2205 Diane St