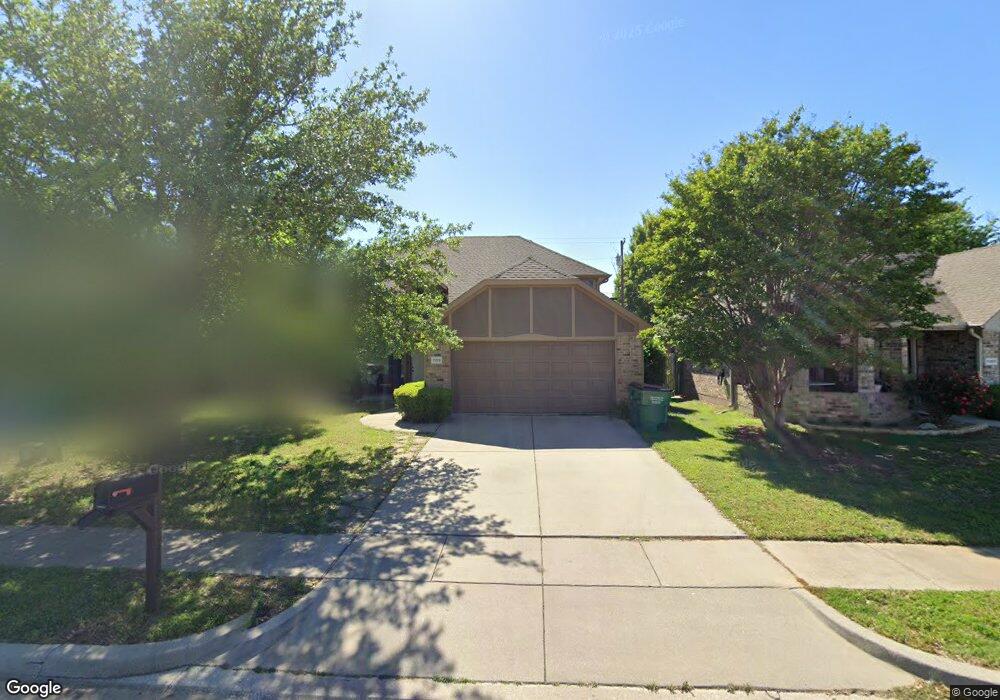
1109 Vintage Ave Gainesville, TX 76240
Estimated Value: $292,000 - $314,000
4
Beds
3
Baths
2,003
Sq Ft
$149/Sq Ft
Est. Value
About This Home
This home is located at 1109 Vintage Ave, Gainesville, TX 76240 and is currently estimated at $298,787, approximately $149 per square foot. 1109 Vintage Ave is a home located in Cooke County with nearby schools including Edison Elementary School, W.E. Chalmers Elementary School, and Gainesville Jr. High School.
Ownership History
Date
Name
Owned For
Owner Type
Purchase Details
Closed on
Oct 18, 2023
Sold by
Evangelista Esmeraldo Jimenez
Bought by
Evangelista Arleen
Current Estimated Value
Purchase Details
Closed on
Oct 14, 2020
Sold by
Howe Chalrles and Pena Rachel
Bought by
Evangelista Arleen Dizon and Evangelista Esmeraldo Jimenez
Home Financials for this Owner
Home Financials are based on the most recent Mortgage that was taken out on this home.
Original Mortgage
$209,000
Interest Rate
2.9%
Mortgage Type
New Conventional
Purchase Details
Closed on
Dec 22, 2016
Sold by
Sk Development L P
Bought by
Howe Charles
Home Financials for this Owner
Home Financials are based on the most recent Mortgage that was taken out on this home.
Original Mortgage
$154,156
Interest Rate
4.4%
Mortgage Type
FHA
Create a Home Valuation Report for This Property
The Home Valuation Report is an in-depth analysis detailing your home's value as well as a comparison with similar homes in the area
Home Values in the Area
Average Home Value in this Area
Purchase History
| Date | Buyer | Sale Price | Title Company |
|---|---|---|---|
| Evangelista Arleen | -- | None Listed On Document | |
| Evangelista Arleen Dizon | -- | None Available | |
| Howe Charles | -- | None Available |
Source: Public Records
Mortgage History
| Date | Status | Borrower | Loan Amount |
|---|---|---|---|
| Previous Owner | Evangelista Arleen Dizon | $209,000 | |
| Previous Owner | Howe Charles | $154,156 |
Source: Public Records
Tax History Compared to Growth
Tax History
| Year | Tax Paid | Tax Assessment Tax Assessment Total Assessment is a certain percentage of the fair market value that is determined by local assessors to be the total taxable value of land and additions on the property. | Land | Improvement |
|---|---|---|---|---|
| 2025 | $5,620 | $284,185 | $49,500 | $234,685 |
| 2024 | $5,620 | $296,537 | $49,500 | $247,037 |
| 2023 | $5,691 | $290,082 | $45,000 | $245,082 |
| 2022 | $5,932 | $272,467 | $45,000 | $227,467 |
| 2021 | $5,120 | $198,835 | $30,000 | $168,835 |
| 2020 | $5,079 | $191,254 | $30,000 | $161,254 |
| 2019 | $5,259 | $192,431 | $30,000 | $162,431 |
| 2018 | $4,907 | $179,808 | $30,000 | $149,808 |
| 2017 | $4,481 | $164,808 | $22,000 | $142,808 |
| 2015 | $4,159 | $157,716 | $22,000 | $135,716 |
| 2014 | $4,159 | $156,277 | $22,000 | $134,277 |
Source: Public Records
Map
Nearby Homes
- 1822 Vallana Dr
- 1800 Silver Oaks Dr
- 1135 Vintage Ave
- 1704 Harris St
- 1722 Morningside Dr
- 1108 Locust St
- 1714 Laurel Rd
- 1522 Harris St
- 1520 Harris St
- 1408 Doty St
- 1200 S Wine St
- 1706 E Garnett St
- 402 Melody Ln
- 1914 Laurel Rd
- 3291 Fm 372
- 405 Meadow Dr
- 1905 Bridle Ln
- 1428 E Garnett St
- 1005 S Clements St
- 1118 S Grand Ave