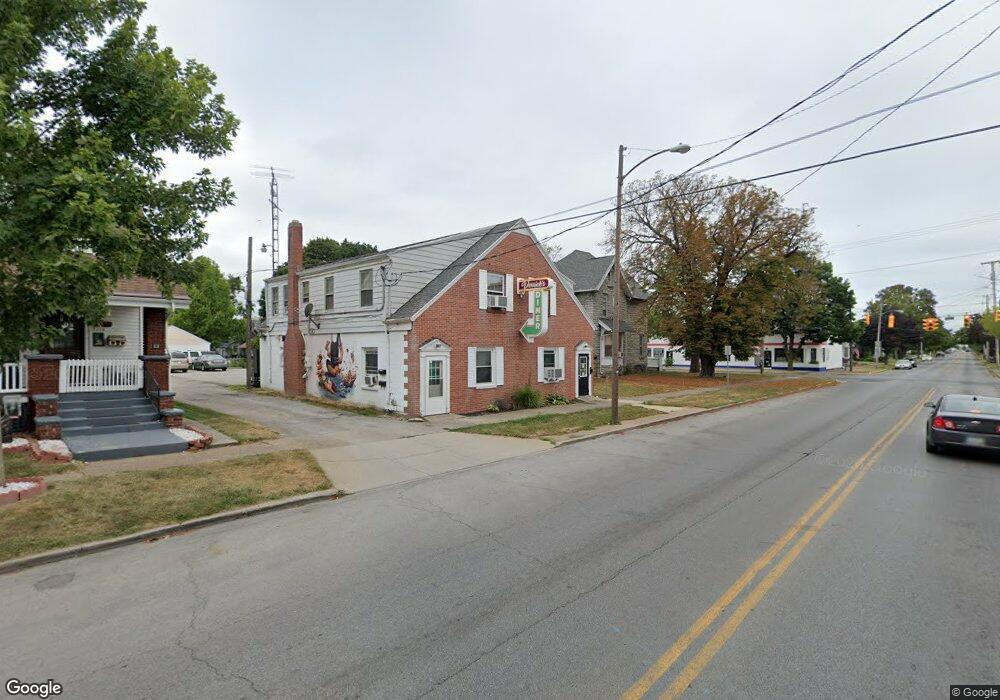
1109 Warren St Sandusky, OH 44870
Estimated Value: $218,724
--
Bed
--
Bath
1,568
Sq Ft
$139/Sq Ft
Est. Value
About This Home
This home is located at 1109 Warren St, Sandusky, OH 44870 and is currently estimated at $218,724, approximately $139 per square foot. 1109 Warren St is a home located in Erie County with nearby schools including Sandusky High School, Monroe Preparatory Academy, and Sandusky Central Catholic School.
Ownership History
Date
Name
Owned For
Owner Type
Purchase Details
Closed on
Feb 22, 2011
Sold by
Tallman Jami S and Townsend Michael A
Bought by
Talltown Investments Llc
Current Estimated Value
Home Financials for this Owner
Home Financials are based on the most recent Mortgage that was taken out on this home.
Original Mortgage
$93,000
Interest Rate
4.81%
Mortgage Type
Commercial
Purchase Details
Closed on
Feb 18, 2011
Sold by
Ehrnsberger Marilyn A
Bought by
Tallman Jami S
Home Financials for this Owner
Home Financials are based on the most recent Mortgage that was taken out on this home.
Original Mortgage
$93,000
Interest Rate
4.81%
Mortgage Type
Commercial
Purchase Details
Closed on
Jan 31, 2008
Sold by
Ehrnsberger Marilyn A
Bought by
Tallman Jami S
Home Financials for this Owner
Home Financials are based on the most recent Mortgage that was taken out on this home.
Original Mortgage
$87,500
Interest Rate
5.5%
Mortgage Type
Seller Take Back
Create a Home Valuation Report for This Property
The Home Valuation Report is an in-depth analysis detailing your home's value as well as a comparison with similar homes in the area
Home Values in the Area
Average Home Value in this Area
Purchase History
| Date | Buyer | Sale Price | Title Company |
|---|---|---|---|
| Talltown Investments Llc | -- | Lawyers Title Ins Corp | |
| Tallman Jami S | $92,500 | Lawyers Title Ins Corp | |
| Tallman Jami S | $92,500 | None Available |
Source: Public Records
Mortgage History
| Date | Status | Borrower | Loan Amount |
|---|---|---|---|
| Closed | Talltown Investments Llc | $93,000 | |
| Previous Owner | Tallman Jami S | $87,500 |
Source: Public Records
Tax History Compared to Growth
Tax History
| Year | Tax Paid | Tax Assessment Tax Assessment Total Assessment is a certain percentage of the fair market value that is determined by local assessors to be the total taxable value of land and additions on the property. | Land | Improvement |
|---|---|---|---|---|
| 2024 | $2,397 | $41,863 | $1,396 | $40,467 |
| 2023 | $2,397 | $36,200 | $1,242 | $34,958 |
| 2022 | $2,491 | $36,200 | $1,242 | $34,958 |
| 2021 | $2,634 | $36,200 | $1,240 | $34,960 |
| 2020 | $2,388 | $33,460 | $1,240 | $32,220 |
| 2019 | $2,434 | $33,460 | $1,240 | $32,220 |
| 2018 | $2,420 | $33,460 | $1,240 | $32,220 |
| 2017 | $2,463 | $33,400 | $1,240 | $32,160 |
| 2016 | $2,455 | $33,400 | $1,240 | $32,160 |
| 2015 | $2,283 | $33,400 | $1,240 | $32,160 |
| 2014 | $2,310 | $33,460 | $3,210 | $30,250 |
| 2013 | $2,303 | $33,460 | $3,210 | $30,250 |
Source: Public Records
Map
Nearby Homes
- 1311 Franklin St
- 510 Reese St
- 404 Reese St
- 0 Milan Rd Unit 3997231
- 0 Milan Rd Unit 3805445
- 0 Milan Rd Unit 20182198
- 221 Scott St
- 919 Hancock St
- 919 3rd St
- 221 Reese St
- 1031 Columbus Ave
- 1035 Campbell St
- 909 1st St
- 1005 1st St
- 801 Hayes Ave
- 1230 5th St
- 611 Lockwood Ave
- 817 Hayes Ave
- 516 Franklin St
- 514 Franklin St