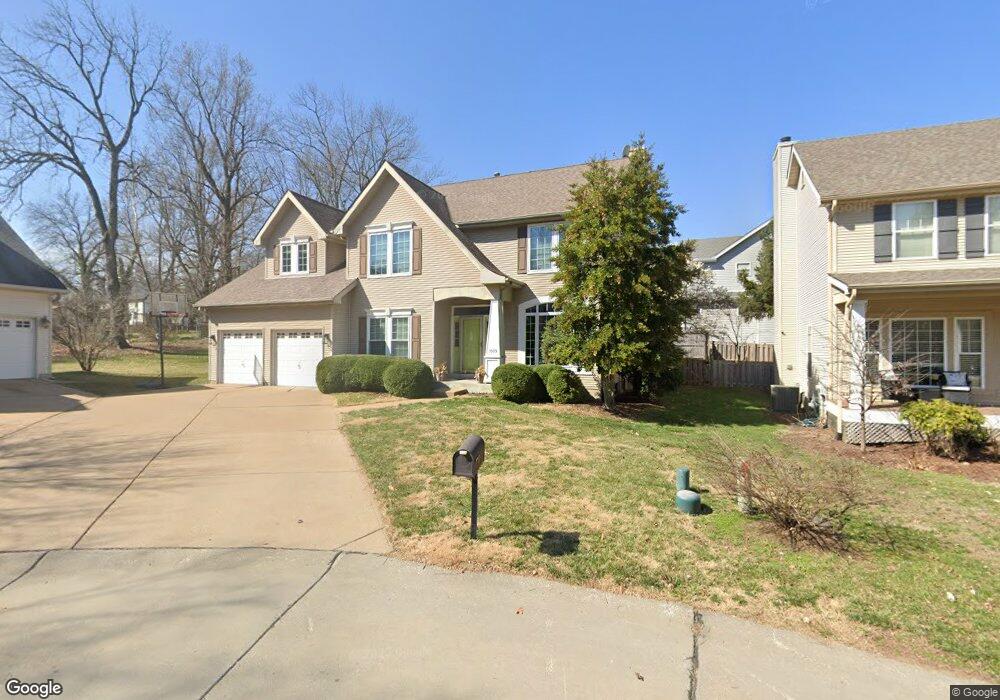
1109 Webster Crossing Ct Saint Louis, MO 63119
Estimated Value: $704,000 - $879,000
4
Beds
5
Baths
2,688
Sq Ft
$289/Sq Ft
Est. Value
About This Home
This home is located at 1109 Webster Crossing Ct, Saint Louis, MO 63119 and is currently estimated at $775,819, approximately $288 per square foot. 1109 Webster Crossing Ct is a home located in St. Louis County with nearby schools including Avery Elementary School, Hixson Middle School, and Webster Groves High School.
Ownership History
Date
Name
Owned For
Owner Type
Purchase Details
Closed on
Mar 17, 2011
Sold by
Ortmann Christopher J and Ortmann Elizabeth A
Bought by
Kurth Amy and Kurth Brian
Current Estimated Value
Home Financials for this Owner
Home Financials are based on the most recent Mortgage that was taken out on this home.
Original Mortgage
$387,600
Outstanding Balance
$266,194
Interest Rate
4.78%
Mortgage Type
New Conventional
Estimated Equity
$509,625
Purchase Details
Closed on
Jun 29, 2000
Sold by
Hughes Shawn A and Hughes Renee A
Bought by
Ortmann Christopher J and Ortmann Elizabeth A
Home Financials for this Owner
Home Financials are based on the most recent Mortgage that was taken out on this home.
Original Mortgage
$228,000
Interest Rate
8.56%
Purchase Details
Closed on
Aug 18, 1997
Sold by
Bruno Citation Homes Inc
Bought by
Hughes Shawn A and Hughes Renee A
Home Financials for this Owner
Home Financials are based on the most recent Mortgage that was taken out on this home.
Original Mortgage
$206,960
Interest Rate
7.6%
Create a Home Valuation Report for This Property
The Home Valuation Report is an in-depth analysis detailing your home's value as well as a comparison with similar homes in the area
Home Values in the Area
Average Home Value in this Area
Purchase History
| Date | Buyer | Sale Price | Title Company |
|---|---|---|---|
| Kurth Amy | $408,000 | Inv | |
| Ortmann Christopher J | $285,000 | -- | |
| Hughes Shawn A | -- | -- |
Source: Public Records
Mortgage History
| Date | Status | Borrower | Loan Amount |
|---|---|---|---|
| Open | Kurth Amy | $387,600 | |
| Previous Owner | Ortmann Christopher J | $228,000 | |
| Previous Owner | Hughes Shawn A | $206,960 |
Source: Public Records
Tax History
| Year | Tax Paid | Tax Assessment Tax Assessment Total Assessment is a certain percentage of the fair market value that is determined by local assessors to be the total taxable value of land and additions on the property. | Land | Improvement |
|---|---|---|---|---|
| 2025 | $8,057 | $124,150 | $43,550 | $80,600 |
| 2024 | $8,057 | $116,160 | $31,670 | $84,490 |
| 2023 | $8,018 | $116,160 | $31,670 | $84,490 |
| 2022 | $7,488 | $100,720 | $31,670 | $69,050 |
| 2021 | $7,462 | $100,720 | $31,670 | $69,050 |
| 2020 | $7,706 | $96,920 | $31,670 | $65,250 |
| 2019 | $7,651 | $96,920 | $31,670 | $65,250 |
| 2018 | $7,517 | $84,570 | $22,170 | $62,400 |
| 2017 | $7,467 | $84,570 | $22,170 | $62,400 |
| 2016 | $7,432 | $80,540 | $19,000 | $61,540 |
Source: Public Records
Map
Nearby Homes
- 633 N Forest Ave
- 643 Marshall Ave
- 727 Marshall Ave
- 835 N Forest Ave
- 503 Atalanta Ave
- 650 Clark Ave
- 2649 Melvin Ave
- 517 Clark Ave
- 2639 Louis Ave
- 619 N Bompart Ave
- 2905 Brazeau Ave
- 404 Clark Ave
- 946 Marshall Ave Unit D
- 8737 Magdalen Ave
- 2503 Louis Ave
- 544 Summit Ave
- 2904 Collier Ave
- 8637 Litzsinger Rd
- 1048 Kuhlman Ln
- 1052 Kuhlman Ln
- 1101 Webster Crossing Ct
- 638 E Pacific Ave
- 1117 Webster Crossing Ct
- 634 E Pacific Ave
- 1100 Webster Crossing Ct
- 1108 Webster Crossing Ct
- 1116 Webster Crossing Ct
- 630 E Pacific Ave
- 658 E Pacific Ave
- 626 E Pacific Ave
- 675 N Forest Ave
- 1021 Jamieson Ln
- 669 N Forest Ave
- 661 N Forest Ave
- 622 E Pacific Ave
- 673 N Forest Ave
- 706 E Pacific Ave
- 655 N Forest Ave
- 681 N Forest Ave
- 701 N Forest Ave
Your Personal Tour Guide
Ask me questions while you tour the home.