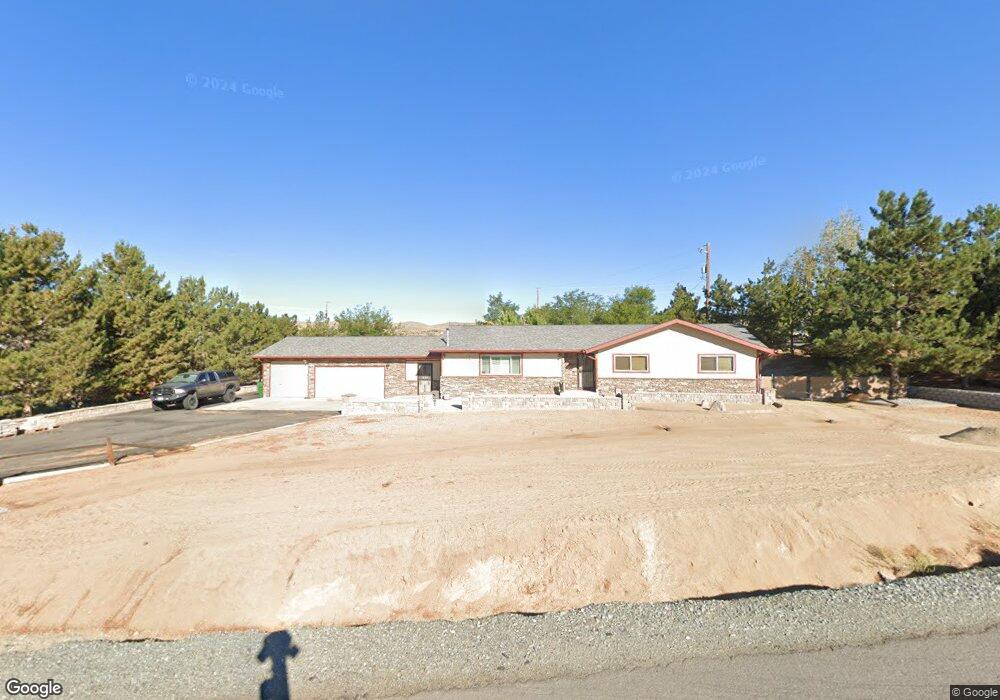
11095 Larson Ranch Rd Reno, NV 89508
Stead NeighborhoodEstimated Value: $586,000 - $639,000
3
Beds
3
Baths
1,980
Sq Ft
$311/Sq Ft
Est. Value
About This Home
This home is located at 11095 Larson Ranch Rd, Reno, NV 89508 and is currently estimated at $615,547, approximately $310 per square foot. 11095 Larson Ranch Rd is a home located in Washoe County with nearby schools including Desert Heights Elementary School, Cold Springs Middle School, and North Valleys High School.
Ownership History
Date
Name
Owned For
Owner Type
Purchase Details
Closed on
May 26, 2006
Sold by
Winter Nickolas A
Bought by
Compilli Dominic J and Compilli Jamie
Current Estimated Value
Home Financials for this Owner
Home Financials are based on the most recent Mortgage that was taken out on this home.
Original Mortgage
$332,000
Outstanding Balance
$191,489
Interest Rate
6.52%
Mortgage Type
Unknown
Estimated Equity
$424,058
Purchase Details
Closed on
Dec 8, 1997
Sold by
Winter Shell Lee
Bought by
Winter Nickolas A
Home Financials for this Owner
Home Financials are based on the most recent Mortgage that was taken out on this home.
Original Mortgage
$78,000
Interest Rate
7.31%
Purchase Details
Closed on
Oct 27, 1994
Sold by
Arndt Robert J and Arndt Arlene J
Bought by
Winter Nickolas A and Winter Shell Lee
Home Financials for this Owner
Home Financials are based on the most recent Mortgage that was taken out on this home.
Original Mortgage
$67,000
Interest Rate
8.7%
Create a Home Valuation Report for This Property
The Home Valuation Report is an in-depth analysis detailing your home's value as well as a comparison with similar homes in the area
Home Values in the Area
Average Home Value in this Area
Purchase History
| Date | Buyer | Sale Price | Title Company |
|---|---|---|---|
| Compilli Dominic J | $415,000 | First Centennial Title Co | |
| Winter Nickolas A | -- | Stewart Title | |
| Winter Nickolas A | $157,500 | Stewart Title |
Source: Public Records
Mortgage History
| Date | Status | Borrower | Loan Amount |
|---|---|---|---|
| Open | Compilli Dominic J | $332,000 | |
| Previous Owner | Winter Nickolas A | $78,000 | |
| Previous Owner | Winter Nickolas A | $67,000 |
Source: Public Records
Tax History
| Year | Tax Paid | Tax Assessment Tax Assessment Total Assessment is a certain percentage of the fair market value that is determined by local assessors to be the total taxable value of land and additions on the property. | Land | Improvement |
|---|---|---|---|---|
| 2026 | $1,840 | $109,246 | $42,000 | $67,246 |
| 2024 | $2,314 | $104,116 | $42,000 | $62,116 |
| 2023 | $2,314 | $100,942 | $42,000 | $58,942 |
| 2022 | $2,247 | $82,638 | $33,250 | $49,389 |
| 2021 | $2,181 | $71,707 | $22,400 | $49,307 |
| 2020 | $2,116 | $71,884 | $22,400 | $49,484 |
| 2019 | $2,054 | $70,926 | $22,820 | $48,106 |
| 2018 | $1,995 | $63,889 | $16,660 | $47,229 |
| 2017 | $1,936 | $63,221 | $15,750 | $47,471 |
| 2016 | $1,887 | $62,836 | $14,315 | $48,521 |
| 2015 | $1,884 | $61,146 | $12,355 | $48,791 |
| 2014 | $1,829 | $58,017 | $10,955 | $47,062 |
| 2013 | -- | $54,795 | $8,470 | $46,325 |
Source: Public Records
Map
Nearby Homes
- 10585 Silver Knolls Blvd
- 10705 Santa fe Rd
- 11000 Bighorn Dr Unit 7
- 11150 Carlsbad Rd
- 10160 Manassas Dr
- 00 Plata Mesa Dr
- 10035 Osage Rd
- 10455 San Fernando Rd
- 12000 N Red Rock Rd
- 10605 Osage Rd
- 10150 Coyote Run Ct
- 11300 Wagon Ho Ln
- 0 N Red Rock Rd Unit 7829219
- 9500 N Red Rock Rd
- 17130 E Opal Ct
- 3825 Dyal Ct
- 3440 Canvasback Ln
- 13721 Mount Whitney St
- 17295 Magnetite Dr
- 17115 Garnet Dr
- 11055 Larson Ranch Rd
- 11105 Larson Ranch Rd
- 11050 Larson Ranch Rd
- 11125 Larson Ranch Rd
- 10925 Silver Knolls Blvd
- 10905 Silver Knolls Blvd
- 11100 Larson Ranch Rd
- 10950 Silver Knolls Blvd
- 10895 Silver Knolls Blvd
- 11120 Larson Ranch Rd
- 11145 Larson Ranch Rd
- 10775 Whitehawk Dr
- 10975 Silver Knolls Blvd
- 10875 Silver Knolls Blvd
- 10735 Whitehawk Dr
- 10755 Whitehawk Dr
- 11140 Larson Ranch Rd
- 10900 Abilene Rd Unit 6A
- 10995 Silver Knolls Blvd
- 11160 Larson Ranch Rd
Your Personal Tour Guide
Ask me questions while you tour the home.