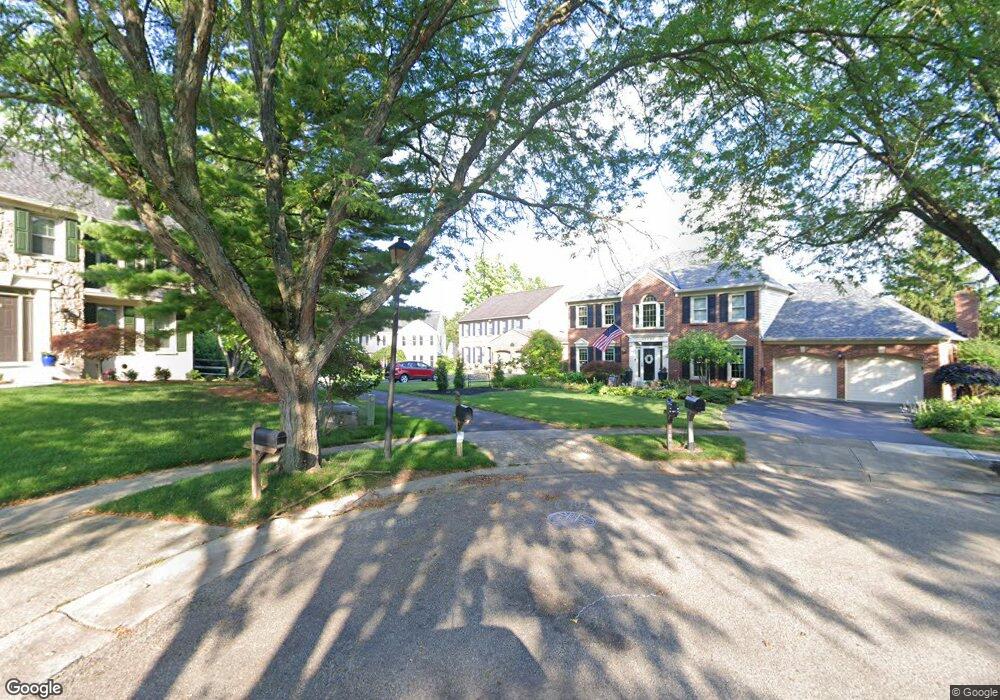
11098 Zaring Ct Cincinnati, OH 45241
Estimated Value: $415,258 - $492,000
4
Beds
3
Baths
2,418
Sq Ft
$188/Sq Ft
Est. Value
About This Home
This home is located at 11098 Zaring Ct, Cincinnati, OH 45241 and is currently estimated at $455,065, approximately $188 per square foot. 11098 Zaring Ct is a home located in Hamilton County with nearby schools including Sharonville Elementary School, Princeton Community Middle School, and Princeton High School.
Ownership History
Date
Name
Owned For
Owner Type
Purchase Details
Closed on
May 24, 2004
Sold by
Kemp Richard M and Kemp Susan A
Bought by
Kemp Richard M and Kemp Susan A
Current Estimated Value
Home Financials for this Owner
Home Financials are based on the most recent Mortgage that was taken out on this home.
Original Mortgage
$76,000
Interest Rate
5.91%
Mortgage Type
New Conventional
Purchase Details
Closed on
Sep 28, 2001
Sold by
Al Kawas Dina H and Al Jamal M
Bought by
Kemp Richard M and Beerck Susan A
Home Financials for this Owner
Home Financials are based on the most recent Mortgage that was taken out on this home.
Original Mortgage
$198,000
Outstanding Balance
$78,070
Interest Rate
6.99%
Estimated Equity
$376,995
Purchase Details
Closed on
Jun 26, 1996
Sold by
Macgilp Neil A and Macgilp Elizabeth M
Bought by
Al Kawas Dina H
Home Financials for this Owner
Home Financials are based on the most recent Mortgage that was taken out on this home.
Original Mortgage
$152,000
Interest Rate
8.13%
Create a Home Valuation Report for This Property
The Home Valuation Report is an in-depth analysis detailing your home's value as well as a comparison with similar homes in the area
Home Values in the Area
Average Home Value in this Area
Purchase History
| Date | Buyer | Sale Price | Title Company |
|---|---|---|---|
| Kemp Richard M | -- | Royal Land Title Agency Ltd | |
| Kemp Richard M | $220,000 | -- | |
| Al Kawas Dina H | $190,000 | -- |
Source: Public Records
Mortgage History
| Date | Status | Borrower | Loan Amount |
|---|---|---|---|
| Closed | Kemp Richard M | $76,000 | |
| Open | Kemp Richard M | $198,000 | |
| Closed | Al Kawas Dina H | $152,000 |
Source: Public Records
Tax History Compared to Growth
Tax History
| Year | Tax Paid | Tax Assessment Tax Assessment Total Assessment is a certain percentage of the fair market value that is determined by local assessors to be the total taxable value of land and additions on the property. | Land | Improvement |
|---|---|---|---|---|
| 2024 | $4,390 | $108,168 | $19,075 | $89,093 |
| 2023 | $4,394 | $108,168 | $19,075 | $89,093 |
| 2022 | $4,544 | $89,905 | $18,886 | $71,019 |
| 2021 | $4,418 | $89,905 | $18,886 | $71,019 |
| 2020 | $4,469 | $89,905 | $18,886 | $71,019 |
| 2019 | $4,458 | $82,481 | $17,325 | $65,156 |
| 2018 | $4,181 | $82,481 | $17,325 | $65,156 |
| 2017 | $3,915 | $82,481 | $17,325 | $65,156 |
| 2016 | $3,984 | $83,245 | $16,853 | $66,392 |
| 2015 | $4,022 | $83,245 | $16,853 | $66,392 |
| 2014 | $4,036 | $83,245 | $16,853 | $66,392 |
| 2013 | $3,685 | $77,798 | $15,750 | $62,048 |
Source: Public Records
Map
Nearby Homes
- 4170 Cornell Rd
- 11220 Foremark Dr
- 4420 Cornell Rd
- 11192 Jardin Place
- 10914 Lemarie Dr
- 10823 Willfleet Dr
- 10775 Lemarie Dr
- 3706 Verbena Dr
- 4086 Retreat Dr
- 10788 Thornview Dr
- 10912 Aztec Ct
- 4051 Beavercreek Cir
- 4071 E Kemper Rd
- Lexington Plan at Chimney Ridge
- Vaquero Plan at Chimney Ridge
- 4254 Fox Hollow Dr
- 3380 Spurrier Ln
- 3592 Horncastle Dr
- 5026 Lord Alfred Ct
- 5600 E Kemper Rd
- 11092 Zaring Ct
- 11104 Zaring Ct
- 4102 Benkert Dr
- 11110 Zaring Ct
- 11086 Zaring Ct
- 4108 Benkert Dr
- 11125 Allenhurst Blvd E
- 4096 Benkert Dr
- 11119 Allenhurst Blvd E
- 11131 Allenhurst Blvd E
- 11107 Allenhurst Blvd E
- 11101 Allenhurst Blvd E
- 11113 Allenhurst Blvd E
- 11111 Zaring Ct
- 4114 Benkert Dr
- 11105 Zaring Ct
- 4121 Benkert Dr
- 11099 Zaring Ct
- 4127 Benkert Dr
- 11093 Zaring Ct