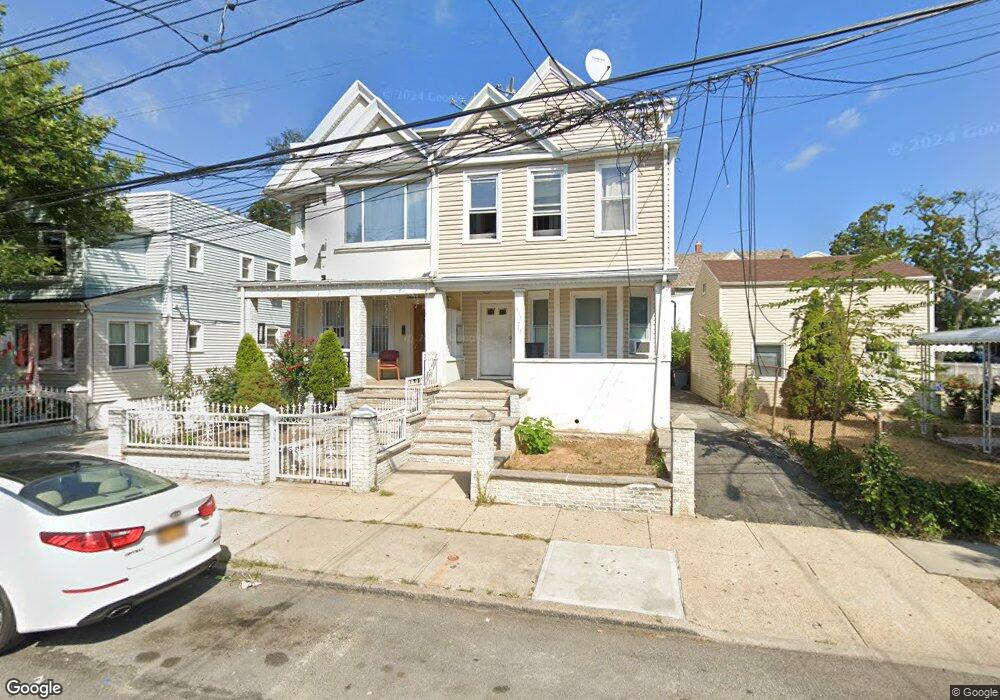
111-11 91st Ave Richmond Hill, NY 11418
Richmond Hill NeighborhoodEstimated Value: $873,207 - $1,060,000
5
Beds
4
Baths
1,980
Sq Ft
$494/Sq Ft
Est. Value
About This Home
This home is located at 111-11 91st Ave, Richmond Hill, NY 11418 and is currently estimated at $978,302, approximately $494 per square foot. 111-11 91st Ave is a home located in Queens County with nearby schools including P.S. 90 - Horace Mann, M.S.137 America's School of Heroes, and Richmond Hill High School.
Ownership History
Date
Name
Owned For
Owner Type
Purchase Details
Closed on
Mar 9, 2015
Sold by
Shionarain Navindranauth and Shionarain Selina
Bought by
Collado Ines M and Collado Pedro J
Current Estimated Value
Home Financials for this Owner
Home Financials are based on the most recent Mortgage that was taken out on this home.
Original Mortgage
$472,000
Outstanding Balance
$360,434
Interest Rate
3.6%
Mortgage Type
New Conventional
Estimated Equity
$617,868
Purchase Details
Closed on
Jun 21, 2002
Sold by
Shionarain Navindranaut and Shionarain Selena
Bought by
Shionarain Navindranaut and Shionarain Selena
Purchase Details
Closed on
Feb 26, 1998
Sold by
Lapietra Peter and Lapietra Martha
Bought by
Shionarain Navindranauth and Shionarain Selena
Home Financials for this Owner
Home Financials are based on the most recent Mortgage that was taken out on this home.
Original Mortgage
$185,000
Interest Rate
6.92%
Create a Home Valuation Report for This Property
The Home Valuation Report is an in-depth analysis detailing your home's value as well as a comparison with similar homes in the area
Home Values in the Area
Average Home Value in this Area
Purchase History
| Date | Buyer | Sale Price | Title Company |
|---|---|---|---|
| Collado Ines M | $590,000 | -- | |
| Shionarain Navindranaut | -- | -- | |
| Shionarain Navindranauth | $212,500 | Pioneer Land Title Corp |
Source: Public Records
Mortgage History
| Date | Status | Borrower | Loan Amount |
|---|---|---|---|
| Open | Collado Ines M | $472,000 | |
| Previous Owner | Shionarain Navindranauth | $185,000 |
Source: Public Records
Tax History Compared to Growth
Tax History
| Year | Tax Paid | Tax Assessment Tax Assessment Total Assessment is a certain percentage of the fair market value that is determined by local assessors to be the total taxable value of land and additions on the property. | Land | Improvement |
|---|---|---|---|---|
| 2025 | $6,950 | $36,979 | $9,080 | $27,899 |
| 2024 | $6,962 | $36,004 | $9,900 | $26,104 |
| 2023 | $6,541 | $33,967 | $9,658 | $24,309 |
| 2022 | $6,111 | $49,320 | $14,040 | $35,280 |
| 2021 | $6,341 | $44,100 | $14,040 | $30,060 |
| 2020 | $6,227 | $43,680 | $14,040 | $29,640 |
| 2019 | $5,983 | $39,480 | $14,040 | $25,440 |
| 2018 | $5,473 | $28,306 | $12,987 | $15,319 |
| 2017 | $5,145 | $26,707 | $11,160 | $15,547 |
| 2016 | $4,944 | $26,707 | $11,160 | $15,547 |
| 2015 | $2,819 | $25,680 | $15,600 | $10,080 |
| 2014 | $2,819 | $25,003 | $15,189 | $9,814 |
Source: Public Records
Map
Nearby Homes
- 87-71 111th St
- 91-14 110th St
- 91-26 110th St
- 87-79 108th St
- 9119 108th St
- 91-16 115th St
- 113-10 Jamaica Ave
- 8801 107th St
- 114-02 Jamaica Ave
- 87-34 116th St
- 9428 112th St
- 10439 90th Ave
- 94-23 115th St
- 94-42 113th St
- 9429 114th St
- 10431 91st Ave
- 91-54 117th St
- 10423 90th Ave
- 9423 115th St
- 9135 117th St