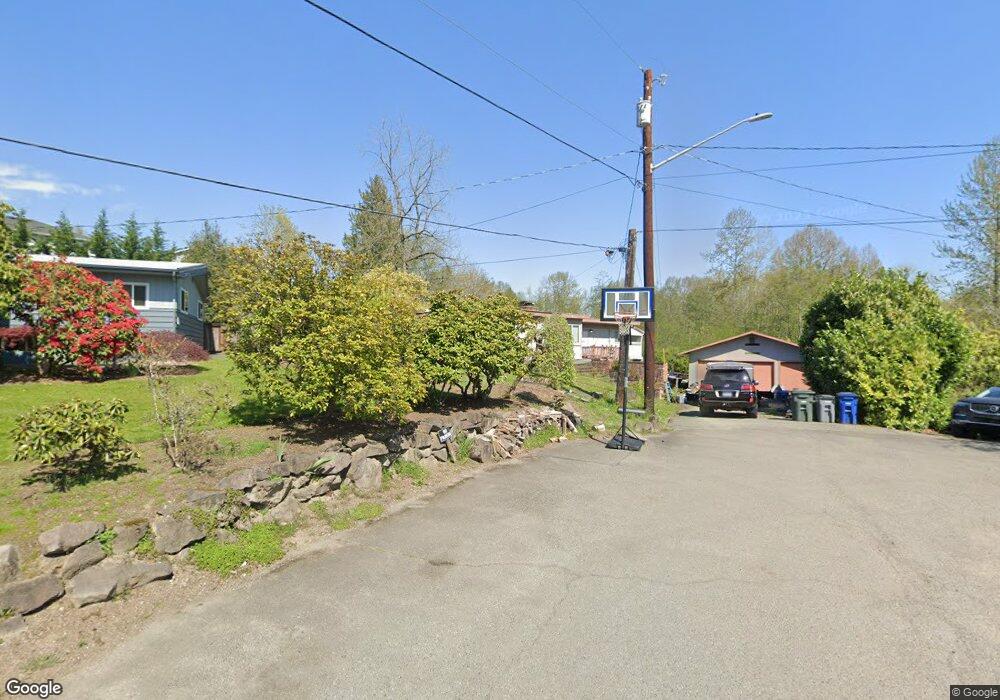
111 243rd Place SE Bothell, WA 98021
Queensborough-Brentwood NeighborhoodEstimated Value: $880,000 - $990,000
3
Beds
3
Baths
1,766
Sq Ft
$531/Sq Ft
Est. Value
About This Home
This home is located at 111 243rd Place SE, Bothell, WA 98021 and is currently estimated at $938,418, approximately $531 per square foot. 111 243rd Place SE is a home located in Snohomish County with nearby schools including Westhill Elementary School, Canyon Park Junior High School, and Bothell High School.
Ownership History
Date
Name
Owned For
Owner Type
Purchase Details
Closed on
Feb 6, 2008
Sold by
Miller George H and Miller Kathleen A
Bought by
Henry Adrian C and Henry Melissa L
Current Estimated Value
Home Financials for this Owner
Home Financials are based on the most recent Mortgage that was taken out on this home.
Original Mortgage
$268,000
Outstanding Balance
$170,017
Interest Rate
6.17%
Mortgage Type
Purchase Money Mortgage
Estimated Equity
$768,401
Purchase Details
Closed on
Jun 15, 2005
Sold by
Miller George H
Bought by
Miller George H and Miller Kathleen A
Home Financials for this Owner
Home Financials are based on the most recent Mortgage that was taken out on this home.
Original Mortgage
$199,000
Interest Rate
8.75%
Mortgage Type
Fannie Mae Freddie Mac
Purchase Details
Closed on
Oct 1, 2004
Sold by
Roush Carolyn J
Bought by
Miller George H
Home Financials for this Owner
Home Financials are based on the most recent Mortgage that was taken out on this home.
Original Mortgage
$160,000
Interest Rate
10.99%
Mortgage Type
Purchase Money Mortgage
Create a Home Valuation Report for This Property
The Home Valuation Report is an in-depth analysis detailing your home's value as well as a comparison with similar homes in the area
Home Values in the Area
Average Home Value in this Area
Purchase History
| Date | Buyer | Sale Price | Title Company |
|---|---|---|---|
| Henry Adrian C | $335,000 | Old Republic Title Ltd | |
| Miller George H | $11,235 | Stewart | |
| Miller George H | $90,000 | Pnwt | |
| Roush Carolyn J | $11,235 | Pnwt |
Source: Public Records
Mortgage History
| Date | Status | Borrower | Loan Amount |
|---|---|---|---|
| Open | Henry Adrian C | $268,000 | |
| Previous Owner | Miller George H | $199,000 | |
| Previous Owner | Miller George H | $160,000 |
Source: Public Records
Tax History
| Year | Tax Paid | Tax Assessment Tax Assessment Total Assessment is a certain percentage of the fair market value that is determined by local assessors to be the total taxable value of land and additions on the property. | Land | Improvement |
|---|---|---|---|---|
| 2025 | $6,067 | $805,900 | $575,000 | $230,900 |
| 2024 | $6,067 | $712,700 | $485,000 | $227,700 |
| 2023 | $6,688 | $861,400 | $615,000 | $246,400 |
| 2022 | $5,936 | $616,200 | $405,000 | $211,200 |
| 2020 | $5,426 | $522,200 | $335,000 | $187,200 |
| 2019 | $4,701 | $467,500 | $280,000 | $187,500 |
| 2018 | $4,409 | $422,400 | $252,000 | $170,400 |
| 2017 | $3,637 | $350,700 | $195,000 | $155,700 |
| 2016 | $3,225 | $320,400 | $170,000 | $150,400 |
Source: Public Records
Map
Nearby Homes
- 7650 NE 204th Place
- 8507 NE 202nd Way
- 20230 86th Place NE
- 7543 NE 203rd St
- 524 238th Place SE Unit C
- 7706 NE 199th St
- 8516 NE 198th St
- 610 237th Place SE Unit B
- 7512 NE 202nd Place
- 19608 82nd Place NE
- 9007 NE 203rd Ln Unit D
- 9008 NE 203rd Ln Unit C
- 9008 NE 203rd Ln Unit B
- 9008 NE 203rd Ln Unit A
- 24123 7th Ave W
- 20343 75th Ave NE
- 9009 NE 203rd Ct Unit D
- 9009 NE 203rd Ct Unit C
- 20341 90th Dr NE Unit F
- 9016 NE 203rd Ct Unit B
- 109 243rd Place SE
- 24229 1st Ave SE
- 110 243rd Place SE
- 24233 1st Ave SE
- 106 243rd Place SE
- 24232 1st Ave SE
- 33 243rd Place SE
- 24223 1st Ave SE
- 24228 1st Ave SE
- 32 243rd Place SE
- 27 243rd Place SE
- 24213 1st Ave SE
- 24219 1st Ave SE
- 24213 1st Ave SE
- 26 243rd Place SE
- 24220 1st Ave SE
- 15 243rd Place SE
- 24203 1st Ave SE
- 8035 NE 205th St
- 36 242nd St SE
Your Personal Tour Guide
Ask me questions while you tour the home.