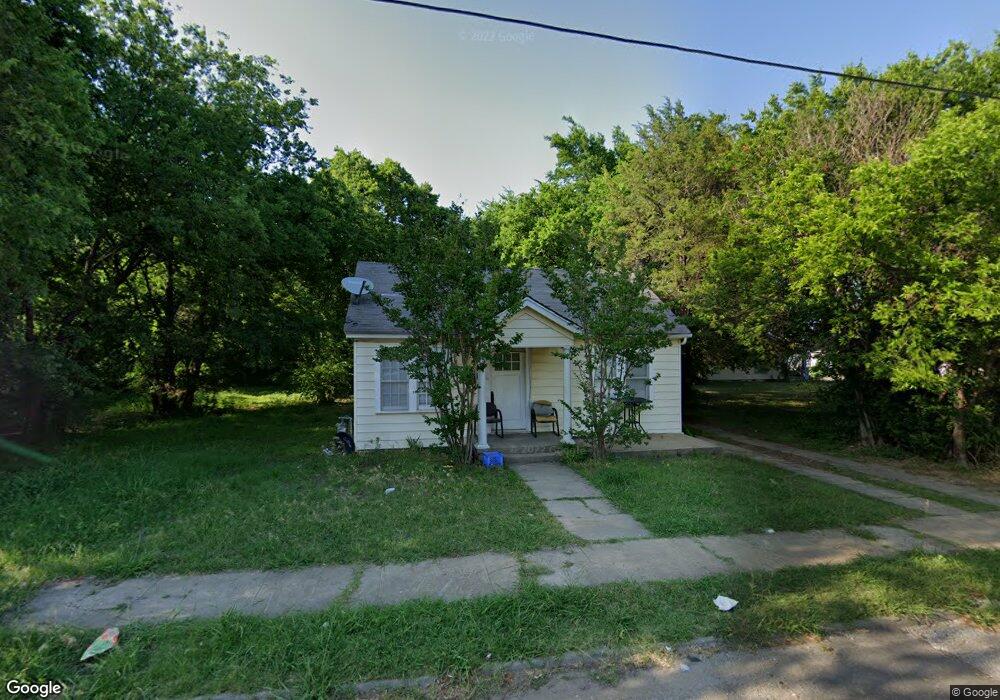
111 3rd Ave SW Ardmore, OK 73401
Estimated Value: $73,000 - $130,000
2
Beds
1
Bath
930
Sq Ft
$104/Sq Ft
Est. Value
About This Home
This home is located at 111 3rd Ave SW, Ardmore, OK 73401 and is currently estimated at $96,373, approximately $103 per square foot. 111 3rd Ave SW is a home located in Carter County with nearby schools including Lincoln Elementary School, Ardmore Middle School, and Ardmore High School.
Ownership History
Date
Name
Owned For
Owner Type
Purchase Details
Closed on
Oct 29, 2025
Sold by
Schel Hall Llc
Bought by
Mccall Kathryn
Current Estimated Value
Home Financials for this Owner
Home Financials are based on the most recent Mortgage that was taken out on this home.
Original Mortgage
$65,000
Outstanding Balance
$65,000
Interest Rate
5.41%
Mortgage Type
Seller Take Back
Estimated Equity
$31,373
Purchase Details
Closed on
Dec 18, 2012
Sold by
Carpenter Schel Hall
Bought by
Schel Hall Llc
Purchase Details
Closed on
Sep 1, 1998
Sold by
Tindale Andrew and Tindale Janic
Bought by
Tindale Janice and Tindale Andre
Purchase Details
Closed on
Jul 31, 1995
Sold by
Clinton Jessie L and Clinton Al
Bought by
Tindale Andrew and Tindale Janic
Purchase Details
Closed on
Mar 27, 1995
Sold by
Stinson Marty
Bought by
Clinton Jessie L and Clinton Al
Create a Home Valuation Report for This Property
The Home Valuation Report is an in-depth analysis detailing your home's value as well as a comparison with similar homes in the area
Purchase History
| Date | Buyer | Sale Price | Title Company |
|---|---|---|---|
| Mccall Kathryn | $65,000 | None Listed On Document | |
| Schel Hall Llc | -- | None Available | |
| Tindale Janice | -- | -- | |
| Tindale Andrew | $19,500 | -- | |
| Clinton Jessie L | $10,000 | -- |
Source: Public Records
Mortgage History
| Date | Status | Borrower | Loan Amount |
|---|---|---|---|
| Open | Mccall Kathryn | $65,000 |
Source: Public Records
Tax History
| Year | Tax Paid | Tax Assessment Tax Assessment Total Assessment is a certain percentage of the fair market value that is determined by local assessors to be the total taxable value of land and additions on the property. | Land | Improvement |
|---|---|---|---|---|
| 2025 | $669 | $6,710 | $1,097 | $5,613 |
| 2024 | $670 | $6,390 | $1,044 | $5,346 |
| 2023 | $638 | $6,086 | $989 | $5,097 |
| 2022 | $554 | $5,796 | $924 | $4,872 |
| 2021 | $557 | $5,520 | $843 | $4,677 |
| 2020 | $523 | $5,257 | $720 | $4,537 |
| 2019 | $521 | $5,365 | $720 | $4,645 |
| 2018 | $540 | $5,473 | $720 | $4,753 |
| 2017 | $506 | $5,538 | $714 | $4,824 |
| 2016 | $492 | $5,275 | $712 | $4,563 |
| 2015 | $386 | $5,024 | $286 | $4,738 |
| 2014 | $502 | $5,605 | $286 | $5,319 |
Source: Public Records
Map
Nearby Homes
Your Personal Tour Guide
Ask me questions while you tour the home.