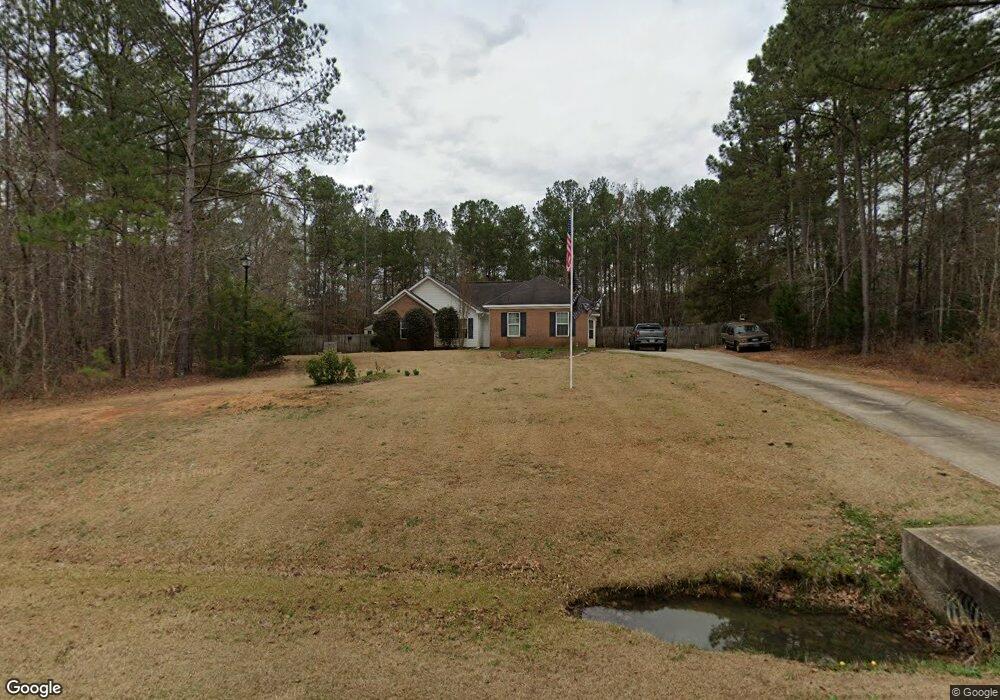
111 Aaron Ct Forsyth, GA 31029
Estimated Value: $240,000 - $304,000
3
Beds
2
Baths
1,472
Sq Ft
$188/Sq Ft
Est. Value
About This Home
This home is located at 111 Aaron Ct, Forsyth, GA 31029 and is currently estimated at $276,718, approximately $187 per square foot. 111 Aaron Ct is a home located in Monroe County with nearby schools including Katherine B. Sutton Elementary School and Mary Persons High School.
Ownership History
Date
Name
Owned For
Owner Type
Purchase Details
Closed on
May 4, 2016
Sold by
Owen Andrew D
Bought by
Turner Albert
Current Estimated Value
Home Financials for this Owner
Home Financials are based on the most recent Mortgage that was taken out on this home.
Original Mortgage
$143,483
Outstanding Balance
$113,339
Interest Rate
3.59%
Mortgage Type
VA
Estimated Equity
$163,379
Purchase Details
Closed on
Aug 30, 2005
Sold by
Preffered Home Builders In
Bought by
Owen Andrew D and Statham Frank D
Home Financials for this Owner
Home Financials are based on the most recent Mortgage that was taken out on this home.
Original Mortgage
$141,680
Interest Rate
5.77%
Mortgage Type
FHA
Purchase Details
Closed on
Aug 4, 2004
Sold by
Rite Way Developers Inc
Bought by
Marler William A
Create a Home Valuation Report for This Property
The Home Valuation Report is an in-depth analysis detailing your home's value as well as a comparison with similar homes in the area
Home Values in the Area
Average Home Value in this Area
Purchase History
| Date | Buyer | Sale Price | Title Company |
|---|---|---|---|
| Turner Albert | $138,900 | -- | |
| Owen Andrew D | $142,800 | -- | |
| Marler William A | $500,000 | -- |
Source: Public Records
Mortgage History
| Date | Status | Borrower | Loan Amount |
|---|---|---|---|
| Open | Turner Albert | $143,483 | |
| Previous Owner | Owen Andrew D | $141,680 |
Source: Public Records
Tax History Compared to Growth
Tax History
| Year | Tax Paid | Tax Assessment Tax Assessment Total Assessment is a certain percentage of the fair market value that is determined by local assessors to be the total taxable value of land and additions on the property. | Land | Improvement |
|---|---|---|---|---|
| 2024 | $1,338 | $79,520 | $12,000 | $67,520 |
| 2023 | $1,284 | $68,360 | $12,000 | $56,360 |
| 2022 | $1,526 | $68,360 | $12,000 | $56,360 |
| 2021 | $1,311 | $58,760 | $10,000 | $48,760 |
| 2020 | $1,053 | $48,640 | $10,000 | $38,640 |
| 2019 | $1,061 | $48,640 | $10,000 | $38,640 |
| 2018 | $948 | $44,640 | $6,000 | $38,640 |
| 2017 | $1,239 | $42,640 | $4,000 | $38,640 |
| 2016 | $1,178 | $42,640 | $4,000 | $38,640 |
| 2015 | $1,117 | $42,640 | $4,000 | $38,640 |
| 2014 | $1,078 | $42,640 | $4,000 | $38,640 |
Source: Public Records
Map
Nearby Homes
- 160 Aaron Ct
- 6418 Georgia 42
- 49 Homestead Cir Unit LOT 49A
- 196 Craig Rd
- 381 Homestead Cir
- 40 Timber Dr
- 738 Teagle Rd
- 3528 Highway 42 S
- 120 Torbet Rd
- 0 Garr Rd Unit 10439858
- LOT 48 Stokes Store Rd
- 49 Stokes Store Rd Unit 49
- 49 Stokes Store Rd
- 119 Mack Cir
- 56 Ivey Cir
- 61 Duncan Cir
- 0 Duncan Cir Unit 24915548
- 674 Stokes Store Rd
- 739 Westbrooks Rd
- 1649 Stokes Store Rd
- 111 Aaron Ct Unit 53
- 121 Aaron Ct
- 135 Saint James St
- 135 Saint James St Unit 54
- 125 Saint James St
- 120 Aaron Ct
- 110 Aaron Ct
- 115 Saint James St
- 122 Aaron Ct
- 201 Saint James St
- 161 Aaron Ct
- 150 Aaron Ct
- 112 Jacob Ct
- 110 Jacob Ct
- 105 Saint James St
- 124 Saint James St
- 136 Saint James St
- 116 Saint James St
- 113 Jacob Ct
- 200 Saint James St