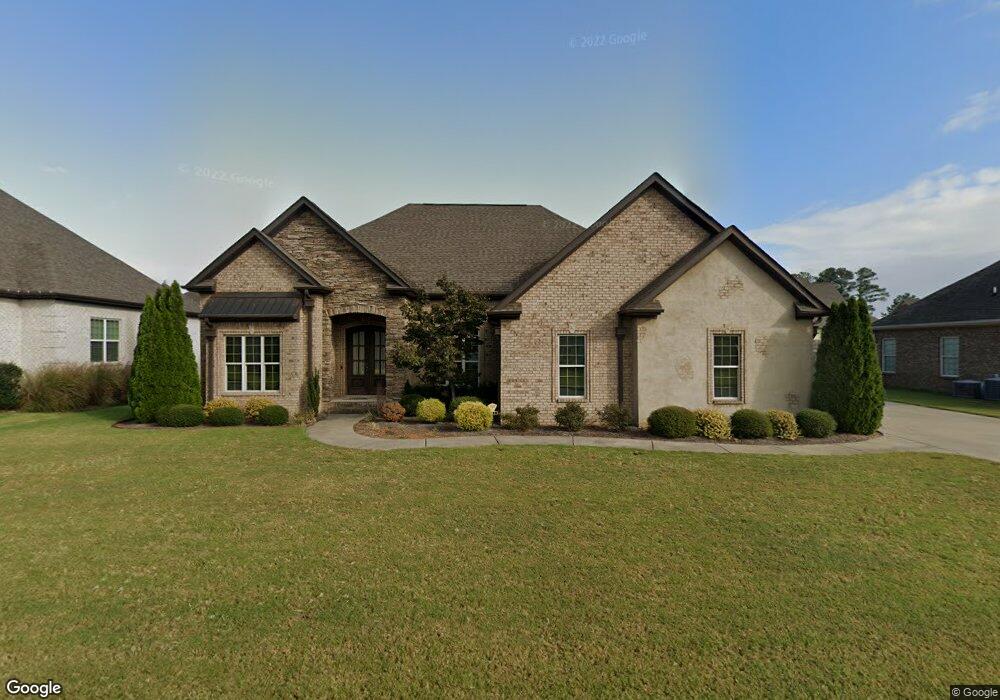
111 Abby Ln Muscle Shoals, AL 35661
Estimated Value: $380,000 - $476,000
--
Bed
1
Bath
2,149
Sq Ft
$195/Sq Ft
Est. Value
About This Home
This home is located at 111 Abby Ln, Muscle Shoals, AL 35661 and is currently estimated at $419,545, approximately $195 per square foot. 111 Abby Ln is a home with nearby schools including McBride Elementary School, Webster Elementary School, and Muscle Shoals Middle School.
Ownership History
Date
Name
Owned For
Owner Type
Purchase Details
Closed on
Dec 30, 2013
Sold by
Baker William C
Bought by
Murphy Michael Keith
Current Estimated Value
Home Financials for this Owner
Home Financials are based on the most recent Mortgage that was taken out on this home.
Original Mortgage
$204,800
Outstanding Balance
$154,554
Interest Rate
4.38%
Estimated Equity
$264,992
Purchase Details
Closed on
Nov 4, 2013
Sold by
Wc Baker Company Llc
Bought by
Baker William C
Home Financials for this Owner
Home Financials are based on the most recent Mortgage that was taken out on this home.
Original Mortgage
$204,800
Outstanding Balance
$154,554
Interest Rate
4.38%
Estimated Equity
$264,992
Create a Home Valuation Report for This Property
The Home Valuation Report is an in-depth analysis detailing your home's value as well as a comparison with similar homes in the area
Home Values in the Area
Average Home Value in this Area
Purchase History
| Date | Buyer | Sale Price | Title Company |
|---|---|---|---|
| Murphy Michael Keith | -- | -- | |
| Baker William C | -- | -- |
Source: Public Records
Mortgage History
| Date | Status | Borrower | Loan Amount |
|---|---|---|---|
| Open | Murphy Michael Keith | $204,800 | |
| Previous Owner | Baker William C | $221,000 |
Source: Public Records
Tax History Compared to Growth
Tax History
| Year | Tax Paid | Tax Assessment Tax Assessment Total Assessment is a certain percentage of the fair market value that is determined by local assessors to be the total taxable value of land and additions on the property. | Land | Improvement |
|---|---|---|---|---|
| 2024 | $1,757 | $42,040 | $5,360 | $36,680 |
| 2023 | $1,660 | $39,740 | $0 | $0 |
| 2022 | $1,276 | $32,560 | $0 | $0 |
| 2021 | $1,254 | $32,020 | $0 | $0 |
| 2020 | $1,194 | $30,540 | $0 | $0 |
| 2019 | $1,145 | $29,340 | $0 | $0 |
| 2018 | $1,080 | $27,740 | $0 | $0 |
| 2017 | $990 | $25,500 | $0 | $0 |
| 2016 | $965 | $24,880 | $0 | $0 |
| 2013 | -- | $0 | $0 | $0 |
Source: Public Records
Map
Nearby Homes