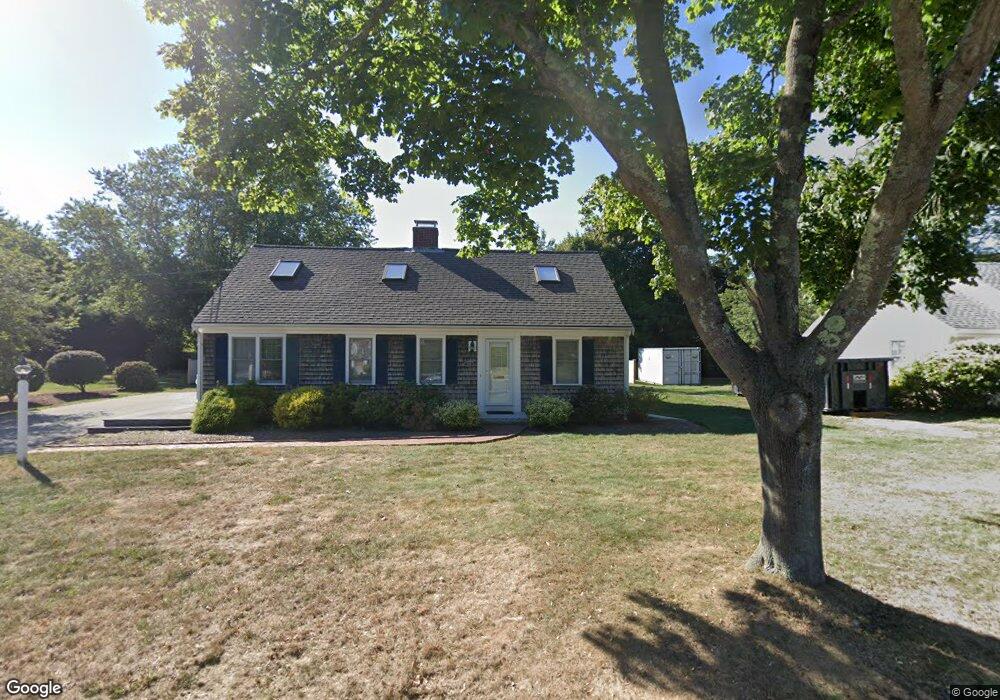
111 Allen Ave Falmouth, MA 02540
Falmouth Village NeighborhoodEstimated Value: $1,229,677 - $1,601,000
4
Beds
2
Baths
1,911
Sq Ft
$740/Sq Ft
Est. Value
About This Home
This home is located at 111 Allen Ave, Falmouth, MA 02540 and is currently estimated at $1,414,419, approximately $740 per square foot. 111 Allen Ave is a home located in Barnstable County with nearby schools including Mullen-Hall School, Lawrence School, and Morse Pond School.
Ownership History
Date
Name
Owned For
Owner Type
Purchase Details
Closed on
Jun 19, 2009
Sold by
111 Allen Avenue Rt and Keating
Bought by
Bell Glenn R and Bell Judy Matte
Current Estimated Value
Home Financials for this Owner
Home Financials are based on the most recent Mortgage that was taken out on this home.
Original Mortgage
$350,000
Outstanding Balance
$222,799
Interest Rate
4.91%
Mortgage Type
Purchase Money Mortgage
Estimated Equity
$1,191,620
Create a Home Valuation Report for This Property
The Home Valuation Report is an in-depth analysis detailing your home's value as well as a comparison with similar homes in the area
Home Values in the Area
Average Home Value in this Area
Purchase History
| Date | Buyer | Sale Price | Title Company |
|---|---|---|---|
| Bell Glenn R | $585,000 | -- | |
| Bell Glenn R | $585,000 | -- |
Source: Public Records
Mortgage History
| Date | Status | Borrower | Loan Amount |
|---|---|---|---|
| Open | Bell Glenn R | $350,000 | |
| Closed | Bell Glenn R | $350,000 | |
| Previous Owner | Bell Glenn R | $115,000 | |
| Previous Owner | Bell Glenn R | $103,000 |
Source: Public Records
Tax History Compared to Growth
Tax History
| Year | Tax Paid | Tax Assessment Tax Assessment Total Assessment is a certain percentage of the fair market value that is determined by local assessors to be the total taxable value of land and additions on the property. | Land | Improvement |
|---|---|---|---|---|
| 2025 | $5,737 | $977,300 | $519,400 | $457,900 |
| 2024 | $5,725 | $911,700 | $496,400 | $415,300 |
| 2023 | $5,037 | $727,900 | $371,200 | $356,700 |
| 2022 | $5,261 | $653,500 | $370,600 | $282,900 |
| 2021 | $5,114 | $601,600 | $354,500 | $247,100 |
| 2020 | $4,714 | $548,800 | $322,300 | $226,500 |
| 2019 | $4,645 | $542,600 | $322,300 | $220,300 |
| 2018 | $4,605 | $535,500 | $322,300 | $213,200 |
| 2017 | $4,499 | $527,400 | $322,300 | $205,100 |
| 2016 | $4,414 | $527,400 | $322,300 | $205,100 |
| 2015 | $4,319 | $527,400 | $322,300 | $205,100 |
| 2014 | $4,281 | $525,300 | $322,400 | $202,900 |
Source: Public Records
Map
Nearby Homes
- 121 Allen Ave
- 276 Shore St
- 253 Scranton Ave
- 57 Meadow Ln
- 133 Mariners Ln
- 480 Main St Unit 1
- 9 Fairmount Ave Unit 1
- 9 Fairmount Ave Unit 2
- 9 Fairmount Ave
- 110 Dillingham Ave Unit 322
- 98 Main St Unit 1
- 71 Main St
- 286 Grand Ave Unit 8
- 286 Grand Ave Unit 6
- 286 Grand Ave Unit 4
- 30 Katherine Lee Bates Rd
- 33 Oakwood Ave
- 28 Hudson St
- 200 Grand Ave
- 17 Elysian Ave