Estimated Value: $238,000 - $267,000
4
Beds
2
Baths
1,794
Sq Ft
$140/Sq Ft
Est. Value
About This Home
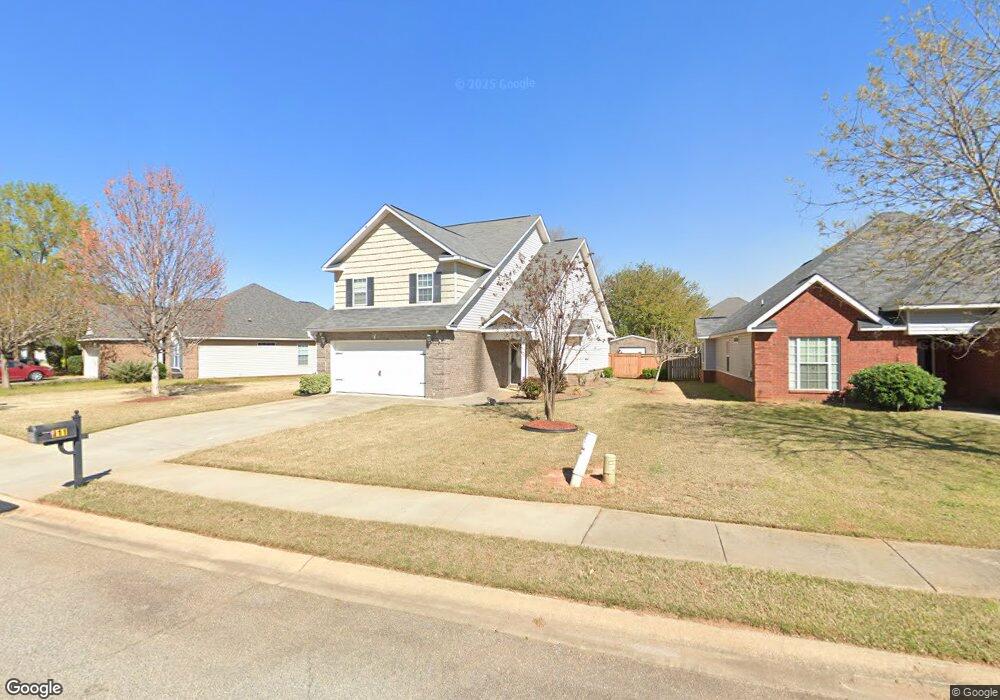
This home is located at 111 Amber Dr, Byron, GA 31008 and is currently estimated at $250,901, approximately $139 per square foot. 111 Amber Dr is a home located in Peach County with nearby schools including Byron Elementary School, Byron Middle School, and Peach County High School.
Ownership History
Date
Name
Owned For
Owner Type
Purchase Details
Closed on
May 15, 2007
Sold by
Decesare Image Homes and Decesare Lan
Bought by
Cleveland Robert L and Cleveland Ruth M
Current Estimated Value
Home Financials for this Owner
Home Financials are based on the most recent Mortgage that was taken out on this home.
Original Mortgage
$116,800
Outstanding Balance
$69,449
Interest Rate
6.12%
Mortgage Type
New Conventional
Estimated Equity
$181,452
Purchase Details
Closed on
Mar 6, 2006
Sold by
Preston Development Llc
Bought by
Cottonwood Land Corp
Purchase Details
Closed on
Feb 17, 2006
Sold by
Cottonwood Land Corporation
Bought by
Decesare Image Homes & Landscaping Inc
Create a Home Valuation Report for This Property
The Home Valuation Report is an in-depth analysis detailing your home's value as well as a comparison with similar homes in the area
Home Values in the Area
Average Home Value in this Area
Purchase History
| Date | Buyer | Sale Price | Title Company |
|---|---|---|---|
| Cleveland Robert L | $146,000 | -- | |
| Cottonwood Land Corp | $920,500 | -- | |
| Decesare Image Homes & Landscaping Inc | -- | -- |
Source: Public Records
Mortgage History
| Date | Status | Borrower | Loan Amount |
|---|---|---|---|
| Open | Cleveland Robert L | $116,800 | |
| Closed | Decesare Image Homes & Landscaping Inc | $0 |
Source: Public Records
Tax History
| Year | Tax Paid | Tax Assessment Tax Assessment Total Assessment is a certain percentage of the fair market value that is determined by local assessors to be the total taxable value of land and additions on the property. | Land | Improvement |
|---|---|---|---|---|
| 2025 | -- | $78,040 | $8,880 | $69,160 |
| 2024 | -- | $70,360 | $8,720 | $61,640 |
| 2023 | $0 | $68,920 | $7,000 | $61,920 |
| 2022 | $2,474 | $61,280 | $7,000 | $54,280 |
| 2021 | $2,182 | $54,040 | $7,000 | $47,040 |
| 2020 | $2,141 | $53,040 | $7,000 | $46,040 |
| 2019 | $2,151 | $53,040 | $7,000 | $46,040 |
| 2018 | $1,673 | $53,040 | $7,000 | $46,040 |
| 2017 | $1,666 | $52,560 | $7,000 | $45,560 |
| 2016 | $1,659 | $52,560 | $7,000 | $45,560 |
| 2015 | $1,661 | $52,560 | $7,000 | $45,560 |
| 2014 | $1,664 | $52,560 | $7,000 | $45,560 |
| 2013 | -- | $52,560 | $7,000 | $45,560 |
Source: Public Records
Map
Nearby Homes
- 217 Caleb Way
- 118 Manchester Ln
- 260 Caleb Way
- 108 Manchester Ln
- 706 Georgian Walk
- 205 White Rd
- 503 Lamplight Dr Unit LOT E9
- 220 Summerstone Bend
- 107 Monroe Ct
- 420 Lamplight Dr
- 104 Monroe Ct
- 508 Timberwind Dr
- 102 Monroe Ct
- 100 Monroe Ct
- 508 Georgian Walk
- 105 Browning Point
- 503 Georgian Walk
- 504 Georgian Walk
- 721 Georgian Walk
- 732 Georgian Walk
Your Personal Tour Guide
Ask me questions while you tour the home.