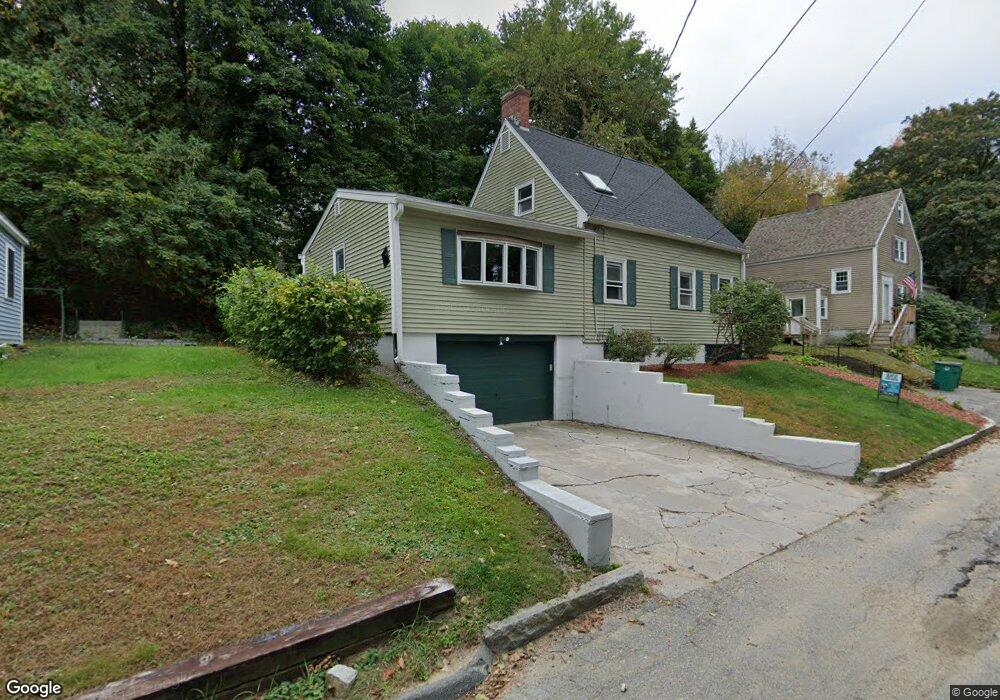
111 Appleton Cir Unit 11 Fitchburg, MA 01420
West Fitchburg NeighborhoodEstimated Value: $322,000 - $411,063
3
Beds
1
Bath
1,200
Sq Ft
$309/Sq Ft
Est. Value
About This Home
This home is located at 111 Appleton Cir Unit 11, Fitchburg, MA 01420 and is currently estimated at $371,266, approximately $309 per square foot. 111 Appleton Cir Unit 11 is a home located in Worcester County with nearby schools including Reingold Elementary School, South Street Elementary School, and Crocker Elementary School.
Ownership History
Date
Name
Owned For
Owner Type
Purchase Details
Closed on
Jun 8, 2012
Sold by
Murphy Paul
Bought by
111 Appleton Circle Ll
Current Estimated Value
Purchase Details
Closed on
Jun 21, 2002
Sold by
Quinaliza Jose and Quinaliza Kathleen A
Bought by
Murphy Paul A
Home Financials for this Owner
Home Financials are based on the most recent Mortgage that was taken out on this home.
Original Mortgage
$110,000
Interest Rate
6.81%
Mortgage Type
Purchase Money Mortgage
Purchase Details
Closed on
Nov 16, 2001
Sold by
Aalto Leonard W and Savage Sandra L
Bought by
Quinaliza Jose M and Stagdon-Quinaliza Kath
Home Financials for this Owner
Home Financials are based on the most recent Mortgage that was taken out on this home.
Original Mortgage
$139,900
Interest Rate
6.7%
Mortgage Type
Purchase Money Mortgage
Create a Home Valuation Report for This Property
The Home Valuation Report is an in-depth analysis detailing your home's value as well as a comparison with similar homes in the area
Home Values in the Area
Average Home Value in this Area
Purchase History
| Date | Buyer | Sale Price | Title Company |
|---|---|---|---|
| 111 Appleton Circle Ll | -- | -- | |
| Murphy Paul A | $150,000 | -- | |
| Quinaliza Jose M | $139,900 | -- |
Source: Public Records
Mortgage History
| Date | Status | Borrower | Loan Amount |
|---|---|---|---|
| Previous Owner | Quinaliza Jose M | $114,000 | |
| Previous Owner | Quinaliza Jose M | $110,000 | |
| Previous Owner | Quinaliza Jose M | $139,900 |
Source: Public Records
Tax History Compared to Growth
Tax History
| Year | Tax Paid | Tax Assessment Tax Assessment Total Assessment is a certain percentage of the fair market value that is determined by local assessors to be the total taxable value of land and additions on the property. | Land | Improvement |
|---|---|---|---|---|
| 2025 | $43 | $321,100 | $102,600 | $218,500 |
| 2024 | $4,120 | $278,200 | $66,400 | $211,800 |
| 2023 | $3,983 | $248,600 | $58,100 | $190,500 |
| 2022 | $3,555 | $201,900 | $49,800 | $152,100 |
| 2021 | $3,538 | $185,900 | $40,300 | $145,600 |
| 2020 | $3,463 | $175,700 | $38,000 | $137,700 |
| 2019 | $3,272 | $159,700 | $49,800 | $109,900 |
| 2018 | $3,120 | $148,500 | $46,300 | $102,200 |
| 2017 | $2,641 | $122,900 | $38,000 | $84,900 |
| 2016 | $2,552 | $120,200 | $34,400 | $85,800 |
| 2015 | $2,426 | $117,300 | $33,200 | $84,100 |
| 2014 | $2,322 | $117,100 | $33,200 | $83,900 |
Source: Public Records
Map
Nearby Homes
- 17 Simonds Rd
- 57 Leroy St
- 70 Sanborn St
- 65 Southwick St
- 465 Franklin Rd
- 35 Bernadette St
- 45 Norwood St
- 14 Felton St
- 87 Eaton St
- 592 Westminster Hill Rd
- 358-360 Fairmount St
- 0 Fairmount St
- 103 Brierwood Dr
- 162 Delisle St
- 51-53 Wachusett St
- 276 Fairmount St
- 15 Cascade St
- 216 Clarendon St
- 34 Oak Leaf Rd
- 95 Loiselle Ave
- 111 Appleton Cir
- 105 Appleton Cir
- 119 Appleton Cir
- 65 Appleton Cir
- 59 Appleton Cir
- 73 Appleton Cir
- 97 Appleton Cir
- 116 Appleton Cir
- 125 Appleton Cir
- 108 Appleton Cir
- 122 Appleton Cir
- 53 Appleton Cir
- 54 Appleton Cir
- 74 Appleton Cir
- 72 Burma Rd
- 132 Appleton Cir
- 137 Appleton Cir
- 80 Appleton Cir
- 80 Appleton Cir Unit 1
- 43 Appleton Cir