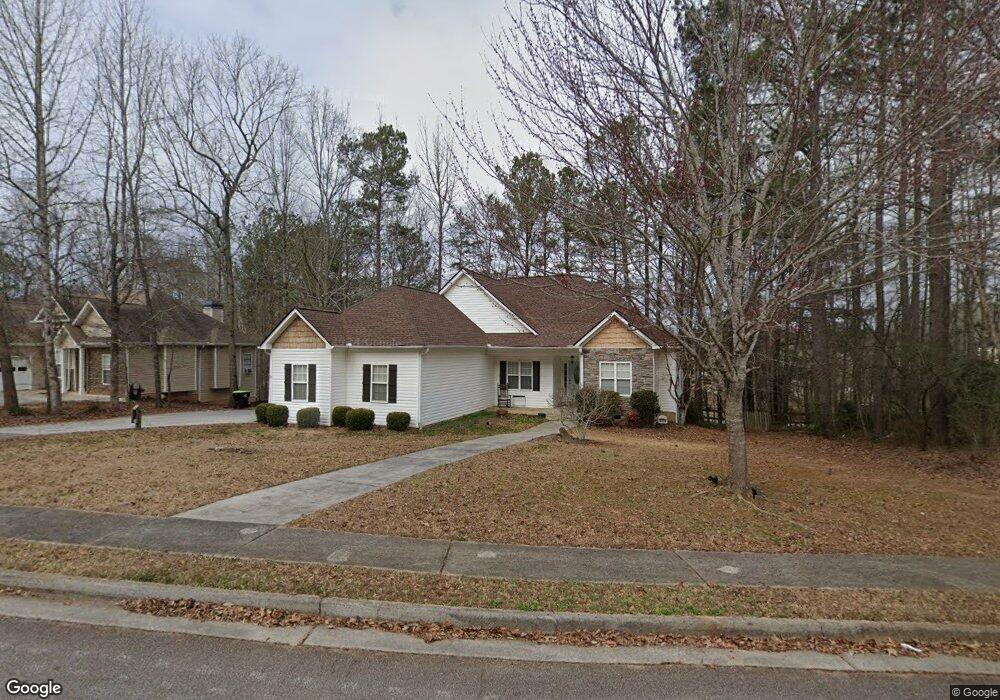
111 Arborwood Way Unit 28 Temple, GA 30179
Estimated Value: $303,000 - $353,000
4
Beds
3
Baths
1,971
Sq Ft
$163/Sq Ft
Est. Value
About This Home
This home is located at 111 Arborwood Way Unit 28, Temple, GA 30179 and is currently estimated at $321,353, approximately $163 per square foot. 111 Arborwood Way Unit 28 is a home located in Carroll County with nearby schools including Providence Elementary School, Temple Middle School, and Temple High School.
Ownership History
Date
Name
Owned For
Owner Type
Purchase Details
Closed on
Oct 14, 2016
Sold by
Craig Robert T
Bought by
Duncan Jeffrey L and Duncan Abbethie D
Current Estimated Value
Home Financials for this Owner
Home Financials are based on the most recent Mortgage that was taken out on this home.
Original Mortgage
$148,989
Outstanding Balance
$119,594
Interest Rate
3.5%
Mortgage Type
New Conventional
Estimated Equity
$201,759
Purchase Details
Closed on
Oct 14, 2005
Sold by
Wingard Thomas R
Bought by
Craig Robert T and Craig Bonnie
Home Financials for this Owner
Home Financials are based on the most recent Mortgage that was taken out on this home.
Original Mortgage
$65,500
Interest Rate
5.71%
Mortgage Type
New Conventional
Purchase Details
Closed on
Jun 7, 2002
Sold by
Rjo Designer Homes Inc
Bought by
Wingard Thomas R and Wingard Joann P
Purchase Details
Closed on
Mar 1, 2002
Sold by
R & D Developers Inc
Bought by
Rjo Designer Homes Inc
Purchase Details
Closed on
Jun 7, 2001
Bought by
R & D Developers Inc
Create a Home Valuation Report for This Property
The Home Valuation Report is an in-depth analysis detailing your home's value as well as a comparison with similar homes in the area
Home Values in the Area
Average Home Value in this Area
Purchase History
| Date | Buyer | Sale Price | Title Company |
|---|---|---|---|
| Duncan Jeffrey L | $147,500 | -- | |
| Craig Robert T | $151,500 | -- | |
| Wingard Thomas R | $130,800 | -- | |
| Rjo Designer Homes Inc | $23,000 | -- | |
| R & D Developers Inc | -- | -- |
Source: Public Records
Mortgage History
| Date | Status | Borrower | Loan Amount |
|---|---|---|---|
| Open | Duncan Jeffrey L | $148,989 | |
| Previous Owner | Craig Robert T | $65,500 |
Source: Public Records
Tax History Compared to Growth
Tax History
| Year | Tax Paid | Tax Assessment Tax Assessment Total Assessment is a certain percentage of the fair market value that is determined by local assessors to be the total taxable value of land and additions on the property. | Land | Improvement |
|---|---|---|---|---|
| 2024 | $3,403 | $127,079 | $8,000 | $119,079 |
| 2023 | $3,403 | $116,200 | $8,000 | $108,200 |
| 2022 | $2,866 | $94,754 | $8,000 | $86,754 |
| 2021 | $2,558 | $82,274 | $8,000 | $74,274 |
| 2020 | $2,296 | $73,552 | $8,000 | $65,552 |
| 2019 | $2,148 | $68,230 | $8,000 | $60,230 |
| 2018 | $1,948 | $60,138 | $8,000 | $52,138 |
| 2017 | $1,689 | $51,546 | $2,000 | $49,546 |
| 2016 | $1,693 | $51,546 | $2,000 | $49,546 |
| 2015 | $1,506 | $43,098 | $8,000 | $35,098 |
| 2014 | $1,514 | $43,098 | $8,000 | $35,098 |
Source: Public Records
Map
Nearby Homes
- 140 Creek Crossing Ln
- 102 Streambank Ct
- 102 Woodside Ct
- The Kimberly Plan at Deer Creek
- The Kyndle Plan at Deer Creek
- The Hudson Plan at Deer Creek
- The Maple Plan at Deer Creek
- The Rose Plan at Deer Creek
- 104 Woodside Ct
- 108 Deer Crossing Unit LOT 3
- 103 Deer Crossing Unit LOT 89
- 107 Antler Trail
- 107 Deer Crossing Unit LOT 88
- 130 Carroll St
- 119 Deer Crossing Unit LOT 85
- 204 Bucks Trail
- 121 E Woodland Manor
- 119 E Johnson St
- 292 E Johnson St
- 111 Arborwood Way
- 113 Arborwood Way
- 136 Creek Crossing Ln Unit 136
- 136 Creek Crossing Ln
- 136 Creek Crossing Ln Unit 29
- 136 Creek Crossing Ln
- 0 Arborwood Way Unit 7145020
- 110 Arborwood Way
- 115 Arborwood Way Unit 26
- 115 Arborwood Way
- 112 Arborwood Way Unit 19
- 112 Arborwood Way
- 108 Arborwood Way
- 106 Arborwood Way
- 116 Arborwood Way
- 126 Creek Crossing Ln
- 116 Arborwood Way
- 116 Arborwood Way
- 137 Creek Crossing Ln
- 104 Streambank Ct