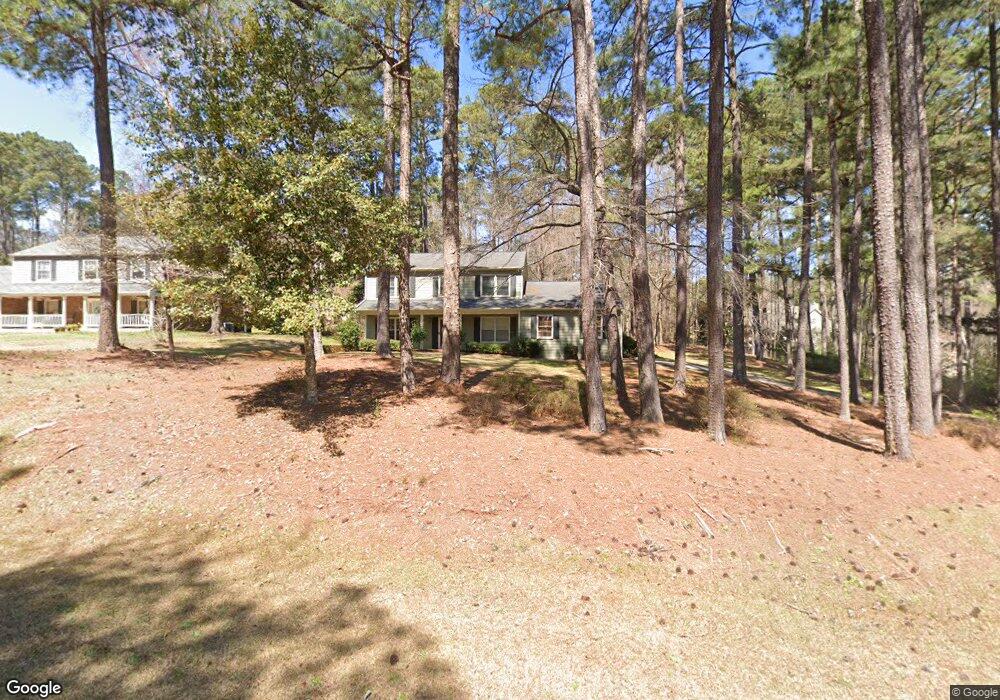
111 Ashling Dr Unit 6 Lagrange, GA 30240
Estimated Value: $326,735 - $360,000
4
Beds
3
Baths
2,261
Sq Ft
$151/Sq Ft
Est. Value
About This Home
This home is located at 111 Ashling Dr Unit 6, Lagrange, GA 30240 and is currently estimated at $341,184, approximately $150 per square foot. 111 Ashling Dr Unit 6 is a home located in Troup County with nearby schools including Franklin Forest Elementary School, Hollis Hand Elementary School, and Ethel W. Kight Elementary School.
Ownership History
Date
Name
Owned For
Owner Type
Purchase Details
Closed on
Aug 14, 2020
Sold by
Hagler Andrew B
Bought by
Harrison Jonathan M
Current Estimated Value
Home Financials for this Owner
Home Financials are based on the most recent Mortgage that was taken out on this home.
Original Mortgage
$216,015
Outstanding Balance
$190,388
Interest Rate
2.9%
Mortgage Type
FHA
Estimated Equity
$150,796
Purchase Details
Closed on
May 18, 2018
Sold by
Garrard Raymond Thurston
Bought by
Hagler Andrew B and Hagler Ashleigh Brooke
Home Financials for this Owner
Home Financials are based on the most recent Mortgage that was taken out on this home.
Original Mortgage
$186,067
Interest Rate
4.37%
Mortgage Type
FHA
Purchase Details
Closed on
Mar 7, 1983
Sold by
West Ga Est
Bought by
Garrard Raymond Thurston
Purchase Details
Closed on
Nov 8, 1982
Sold by
Dan Ric
Bought by
West Ga Est
Purchase Details
Closed on
Jun 29, 1981
Bought by
Dan Ric
Create a Home Valuation Report for This Property
The Home Valuation Report is an in-depth analysis detailing your home's value as well as a comparison with similar homes in the area
Purchase History
| Date | Buyer | Sale Price | Title Company |
|---|---|---|---|
| Harrison Jonathan M | $220,000 | -- | |
| Hagler Andrew B | $189,500 | -- | |
| Garrard Raymond Thurston | -- | -- | |
| West Ga Est | -- | -- | |
| Dan Ric | -- | -- |
Source: Public Records
Mortgage History
| Date | Status | Borrower | Loan Amount |
|---|---|---|---|
| Open | Harrison Jonathan M | $216,015 | |
| Previous Owner | Hagler Andrew B | $186,067 |
Source: Public Records
Tax History
| Year | Tax Paid | Tax Assessment Tax Assessment Total Assessment is a certain percentage of the fair market value that is determined by local assessors to be the total taxable value of land and additions on the property. | Land | Improvement |
|---|---|---|---|---|
| 2025 | $2,800 | $132,656 | $18,000 | $114,656 |
| 2024 | $2,800 | $104,660 | $18,000 | $86,660 |
| 2023 | $2,720 | $101,704 | $14,000 | $87,704 |
| 2022 | $2,585 | $94,624 | $14,000 | $80,624 |
| 2021 | $2,533 | $85,964 | $14,000 | $71,964 |
| 2020 | $2,310 | $76,604 | $14,000 | $62,604 |
| 2019 | $2,218 | $73,544 | $12,000 | $61,544 |
| 2018 | $1,941 | $66,344 | $10,280 | $56,064 |
| 2017 | $1,627 | $55,936 | $8,700 | $47,236 |
| 2016 | $1,633 | $56,133 | $8,700 | $47,433 |
| 2015 | $1,684 | $57,726 | $10,293 | $47,433 |
| 2014 | $1,611 | $55,230 | $10,293 | $44,937 |
| 2013 | -- | $56,226 | $10,092 | $46,134 |
Source: Public Records
Map
Nearby Homes
- 1784 Mooty Bridge Rd
- 104 Sweetgum Dr
- 104 Englewood Dr
- 114 Red Oak Trail
- 502 Ashford Cir
- 103 Woodchase
- 102 Woodchase
- 103 Windridge
- 107 Windridge
- 109 Windridge
- 209 River Oaks Dr
- 110 Pond View Point
- 91 Richmond Dr
- 102 Beech Creek Dr
- 204 Dixie Creek Dr
- 203 S Chilton Crescent
- 201 S Chilton Crescent
- 732 Camellia Dr
- 724 Camellia Dr
- 106 Highland Park
- 111 Ashling Dr
- 109 Ashling Dr
- 113 Ashling Dr
- 208 Ridgeview Ct
- 210 Ridgeview Ct
- 110 Ashling Dr
- 115 Ashling Dr
- 107 Ashling Dr
- 108 Ashling Dr
- 112 Ashling Dr
- 206 Ridgeview Ct
- 106 Ashling Dr
- 207 Ridgeview Ct Unit 33&33B
- 207 Ridgeview Ct
- 114 Ashling Dr
- 105 Ashling Dr
- 117 Ashling Dr
- 107 Saint Anthony Dr
- 209 Ridgeview Ct
- 107 St Anthony Dr
Your Personal Tour Guide
Ask me questions while you tour the home.