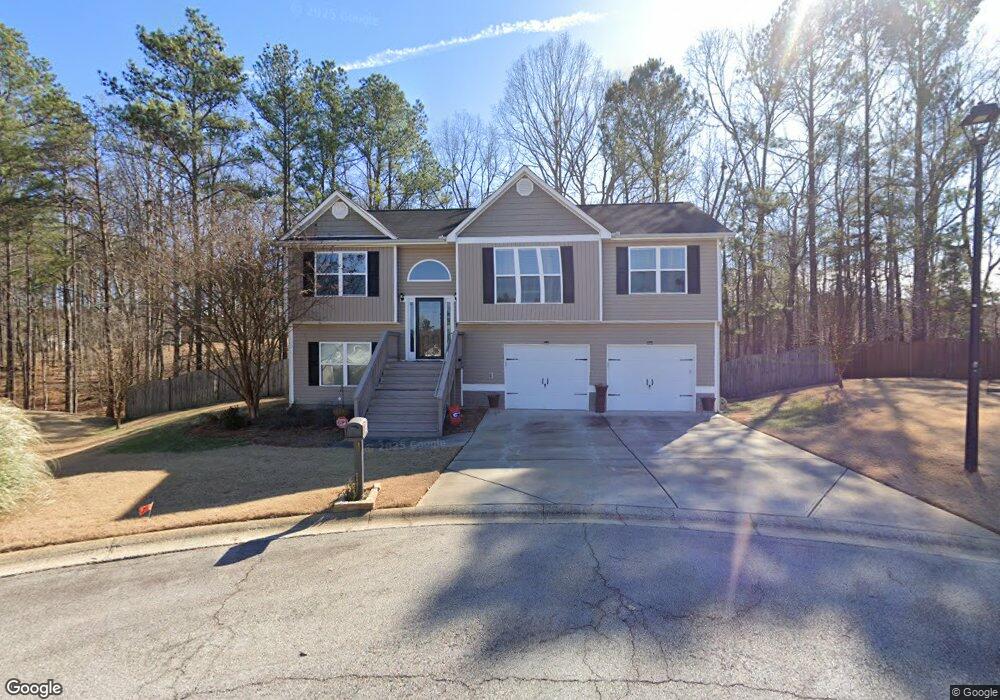
111 Autumn Brooke Trail Unit 74 Dallas, GA 30157
Estimated Value: $308,000 - $353,000
3
Beds
2
Baths
1,288
Sq Ft
$255/Sq Ft
Est. Value
About This Home
This home is located at 111 Autumn Brooke Trail Unit 74, Dallas, GA 30157 and is currently estimated at $328,112, approximately $254 per square foot. 111 Autumn Brooke Trail Unit 74 is a home located in Paulding County with nearby schools including Allgood Elementary School, Herschel Jones Middle School, and Paulding County High School.
Ownership History
Date
Name
Owned For
Owner Type
Purchase Details
Closed on
Oct 20, 2017
Sold by
Arnone Joseph R
Bought by
Mitchell Travious B
Current Estimated Value
Home Financials for this Owner
Home Financials are based on the most recent Mortgage that was taken out on this home.
Original Mortgage
$183,000
Outstanding Balance
$152,898
Interest Rate
3.83%
Mortgage Type
VA
Estimated Equity
$175,214
Purchase Details
Closed on
May 15, 2015
Sold by
S & S Homes Inc
Bought by
Arnone Joseph R
Home Financials for this Owner
Home Financials are based on the most recent Mortgage that was taken out on this home.
Original Mortgage
$143,208
Interest Rate
3.79%
Mortgage Type
FHA
Purchase Details
Closed on
May 30, 2014
Sold by
Affinity Bank
Bought by
S & S Homes Inc
Create a Home Valuation Report for This Property
The Home Valuation Report is an in-depth analysis detailing your home's value as well as a comparison with similar homes in the area
Home Values in the Area
Average Home Value in this Area
Purchase History
| Date | Buyer | Sale Price | Title Company |
|---|---|---|---|
| Mitchell Travious B | $185,000 | -- | |
| Arnone Joseph R | $145,850 | -- | |
| S & S Homes Inc | $45,000 | -- |
Source: Public Records
Mortgage History
| Date | Status | Borrower | Loan Amount |
|---|---|---|---|
| Open | Mitchell Travious B | $183,000 | |
| Previous Owner | Arnone Joseph R | $143,208 |
Source: Public Records
Tax History Compared to Growth
Tax History
| Year | Tax Paid | Tax Assessment Tax Assessment Total Assessment is a certain percentage of the fair market value that is determined by local assessors to be the total taxable value of land and additions on the property. | Land | Improvement |
|---|---|---|---|---|
| 2024 | $777 | $142,952 | $12,000 | $130,952 |
| 2023 | $3,679 | $123,832 | $12,000 | $111,832 |
| 2022 | $2,820 | $110,044 | $12,000 | $98,044 |
| 2021 | $2,412 | $84,872 | $8,000 | $76,872 |
| 2020 | $2,667 | $80,372 | $8,000 | $72,372 |
| 2019 | $2,262 | $67,588 | $8,000 | $59,588 |
| 2018 | $1,956 | $66,800 | $12,000 | $54,800 |
| 2017 | $1,904 | $56,484 | $12,800 | $43,684 |
| 2016 | $1,858 | $55,644 | $12,800 | $42,844 |
| 2015 | $111 | $3,600 | $3,600 | $0 |
| 2014 | $64 | $2,040 | $2,040 | $0 |
| 2013 | -- | $1,280 | $1,280 | $0 |
Source: Public Records
Map
Nearby Homes
- 120 Remington Place Blvd
- 102 Natalie Ct
- 212 Remington Place Blvd
- 305 Remington Place Blvd
- 98 Shawnee Trail Unit 30
- 98 Shawnee Trail
- 361 West Ave
- 146 Shawnee Trail Unit Lot 27
- 146 Shawnee Trail
- 47 Whitley Ct
- 0 Shawnee Trail Unit LOT 6 10506625
- 0 Shawnee Trail Unit 7565433
- 166 Shawnee Trail Unit 25
- 166 Shawnee Trail
- 154 Shawnee Trail Unit Lot 26
- 154 Shawnee Trail
- 512 Oak View Ln
- 510 Oak View Ln
- 508 Oak View Ln
- 111 Autumn Brooke Trail
- 109 Autumn Brooke Trail
- 110 Autumn Brooke Trail
- 50 Marci Ln
- 107 Autumn Brooke Trail
- 108 Autumn Brooke Trail Unit 76
- 108 Autumn Brooke Trail
- 106 Autumn Brooke Trail
- 105 Autumn Brooke Trail Unit 71
- 105 Autumn Brooke Trail
- 0 Autumn Brooke Trail Unit 70,71,74,76 7105726
- 0 Autumn Brooke Trail Unit 8670854
- 0 Autumn Brooke Trail Unit 7340000
- 0 Autumn Brooke Trail Unit 8245114
- 0 Autumn Brooke Trail Unit 8631155
- 111 Klintfield Trail
- 104 Autumn Brooke Trail Unit 78
- 104 Autumn Brooke Trail
- 109 Klintfield Trail
- 42 Marci Ln