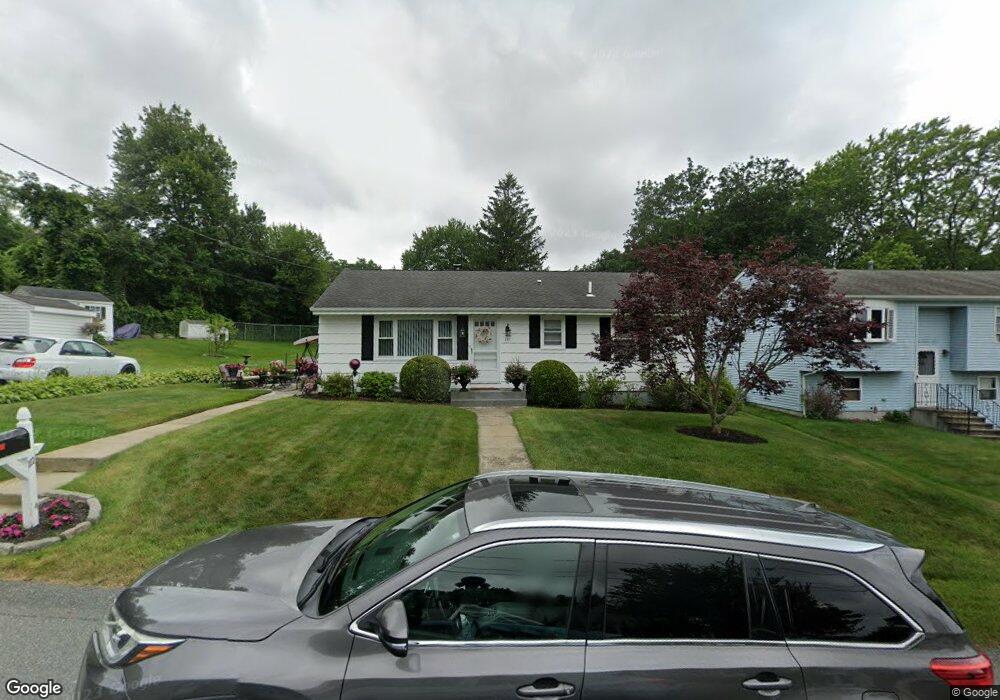
111 Baldwin St Fall River, MA 02720
Western Fall River NeighborhoodEstimated Value: $387,000 - $477,000
3
Beds
1
Bath
1,300
Sq Ft
$327/Sq Ft
Est. Value
About This Home
This home is located at 111 Baldwin St, Fall River, MA 02720 and is currently estimated at $424,816, approximately $326 per square foot. 111 Baldwin St is a home located in Bristol County with nearby schools including North End Elementary School, Morton Middle School, and B M C Durfee High School.
Ownership History
Date
Name
Owned For
Owner Type
Purchase Details
Closed on
Nov 24, 1995
Sold by
Pilkington Frances
Bought by
Mota Mario G and Mota Maria E
Current Estimated Value
Home Financials for this Owner
Home Financials are based on the most recent Mortgage that was taken out on this home.
Original Mortgage
$110,276
Outstanding Balance
$1,523
Interest Rate
7.47%
Mortgage Type
Purchase Money Mortgage
Estimated Equity
$423,293
Create a Home Valuation Report for This Property
The Home Valuation Report is an in-depth analysis detailing your home's value as well as a comparison with similar homes in the area
Home Values in the Area
Average Home Value in this Area
Purchase History
| Date | Buyer | Sale Price | Title Company |
|---|---|---|---|
| Mota Mario G | $113,000 | -- |
Source: Public Records
Mortgage History
| Date | Status | Borrower | Loan Amount |
|---|---|---|---|
| Open | Mota Mario G | $47,375 | |
| Closed | Mota Mario G | $35,000 | |
| Closed | Mota Mario G | $14,632 | |
| Open | Mota Mario G | $110,276 |
Source: Public Records
Tax History
| Year | Tax Paid | Tax Assessment Tax Assessment Total Assessment is a certain percentage of the fair market value that is determined by local assessors to be the total taxable value of land and additions on the property. | Land | Improvement |
|---|---|---|---|---|
| 2025 | $3,728 | $325,600 | $124,300 | $201,300 |
| 2024 | $3,512 | $305,700 | $121,900 | $183,800 |
| 2023 | $3,437 | $280,100 | $109,800 | $170,300 |
| 2022 | $2,875 | $241,700 | $103,600 | $138,100 |
| 2021 | $2,875 | $207,900 | $98,900 | $109,000 |
| 2020 | $2,774 | $192,000 | $94,400 | $97,600 |
| 2019 | $2,757 | $189,100 | $98,700 | $90,400 |
| 2018 | $2,732 | $186,900 | $99,400 | $87,500 |
| 2017 | $2,596 | $185,400 | $99,400 | $86,000 |
| 2016 | $2,509 | $184,100 | $102,500 | $81,600 |
| 2015 | $2,387 | $182,500 | $102,500 | $80,000 |
| 2014 | $2,296 | $182,500 | $102,500 | $80,000 |
Source: Public Records
Map
Nearby Homes
- 33 Warner St
- 257 Calvin St
- Parcel 2 Highcrest Rd
- 1810 Highland Ave Unit 22
- 3636 N Main St Unit 5
- 29 Valentine St
- 274 Archer St
- 195 Crescent St Unit 3
- 210 Harrison Ave
- 2106 Meridian St
- 2714 Riverside Ave
- 108 Stowe St Unit 108
- 247 Albany St
- 230 College Park Rd
- 201 Montgomery Cir
- 1553 Riverside Ave
- 54 Grant Ave
- 1496 Riverside Ave
- 333 Langley St
- 174 Columbus Dr
Your Personal Tour Guide
Ask me questions while you tour the home.