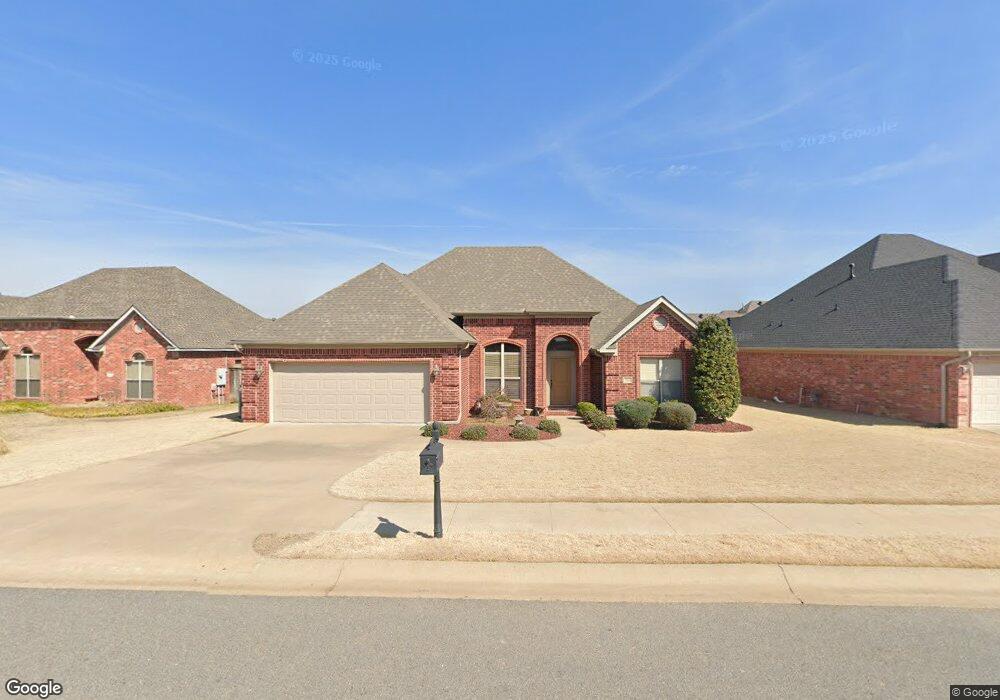
111 Baronne Way Maumelle, AR 72113
Estimated Value: $376,000 - $404,000
--
Bed
1
Bath
2,598
Sq Ft
$149/Sq Ft
Est. Value
About This Home
This home is located at 111 Baronne Way, Maumelle, AR 72113 and is currently estimated at $386,533, approximately $148 per square foot. 111 Baronne Way is a home located in Pulaski County with nearby schools including Crystal Hill Elementary School, Maumelle Middle School, and Maumelle High School.
Ownership History
Date
Name
Owned For
Owner Type
Purchase Details
Closed on
Sep 21, 2020
Sold by
Hollnay Teressa
Bought by
Mobley Pamela
Current Estimated Value
Purchase Details
Closed on
Aug 29, 2018
Sold by
Holloway Teressa
Bought by
Holloway Teressa Ann and Holloway Living Trust
Purchase Details
Closed on
Dec 31, 2013
Sold by
Mobley Pamela Sue
Bought by
Holloway Teressa
Purchase Details
Closed on
Dec 18, 2009
Sold by
Mobley David Alan
Bought by
Mobley Pamela S
Purchase Details
Closed on
Apr 30, 2009
Sold by
Jeff Fuller Homes Llc
Bought by
Mobley Pamela Sue
Home Financials for this Owner
Home Financials are based on the most recent Mortgage that was taken out on this home.
Original Mortgage
$270,902
Interest Rate
4.76%
Mortgage Type
FHA
Create a Home Valuation Report for This Property
The Home Valuation Report is an in-depth analysis detailing your home's value as well as a comparison with similar homes in the area
Home Values in the Area
Average Home Value in this Area
Purchase History
| Date | Buyer | Sale Price | Title Company |
|---|---|---|---|
| Mobley Pamela | -- | None Available | |
| Holloway Teressa Ann | -- | None Available | |
| Holloway Teressa | -- | None Available | |
| Mobley Pamela S | -- | None Available | |
| Mobley Pamela Sue | $276,000 | Commerce Title & Closing Ser |
Source: Public Records
Mortgage History
| Date | Status | Borrower | Loan Amount |
|---|---|---|---|
| Previous Owner | Mobley Pamela Sue | $270,902 |
Source: Public Records
Tax History Compared to Growth
Tax History
| Year | Tax Paid | Tax Assessment Tax Assessment Total Assessment is a certain percentage of the fair market value that is determined by local assessors to be the total taxable value of land and additions on the property. | Land | Improvement |
|---|---|---|---|---|
| 2025 | $3,535 | $62,791 | $8,200 | $54,591 |
| 2024 | $3,950 | $62,791 | $8,200 | $54,591 |
| 2023 | $3,950 | $62,791 | $8,200 | $54,591 |
| 2022 | $3,535 | $62,791 | $8,200 | $54,591 |
| 2021 | $3,334 | $53,000 | $12,300 | $40,700 |
| 2020 | $2,959 | $53,000 | $12,300 | $40,700 |
| 2019 | $2,959 | $53,000 | $12,300 | $40,700 |
| 2018 | $2,914 | $53,000 | $12,300 | $40,700 |
| 2017 | $3,264 | $53,000 | $12,300 | $40,700 |
| 2016 | $2,967 | $47,170 | $9,400 | $37,770 |
| 2015 | $2,967 | $47,170 | $9,400 | $37,770 |
| 2014 | $2,967 | $47,170 | $9,400 | $37,770 |
Source: Public Records
Map
Nearby Homes
- 519 Corondelet Ln
- 510 Corondelet Ln
- 521 Corondelet Ln
- 515 Corondelet Ln
- 605 Corondelet Ln
- 518 Corondelet Ln
- 523 Corondelet Ln
- 513 Corondelet Ln
- 116 Cabanel Dr
- 505 Cain Trail
- 110 Cabanel Dr
- 7 Tm Fly Way
- JUSTIN Plan at The Reserve at Country Club
- DENTON Plan at The Reserve at Country Club
- CALI Plan at The Reserve at Country Club
- KINGSTON Plan at The Reserve at Country Club
- MARSHALL Plan at The Reserve at Country Club
- OZARK Plan at The Reserve at Country Club
- LESLIE Plan at The Reserve at Country Club
- BOONE Plan at The Reserve at Country Club
- 109 Baronne Way
- 113 Baronne Way
- 0 Toulouse Ct Unit 15030289
- 0 Toulouse Ct Unit 16006066
- 0 Toulouse Ct Unit 16009765
- 0 Toulouse Ct Unit 17004010
- 107 Baronne Way
- 115 Baronne Way
- 27 Toulouse Ct
- 112 Baronne Way
- 23 Toulouse Ct
- 114 Baronne Way
- 110 Baronne Way
- 117 Baronne Way
- 0 Baronne Way Unit 15035226
- 0 Baronne Way Unit 16009623
- 0 Baronne Way Unit 16023360
- 0 Baronne Way Unit 16024442
- 0 Baronne Way Unit 17014711
- 0 Baronne Way Unit 17032868