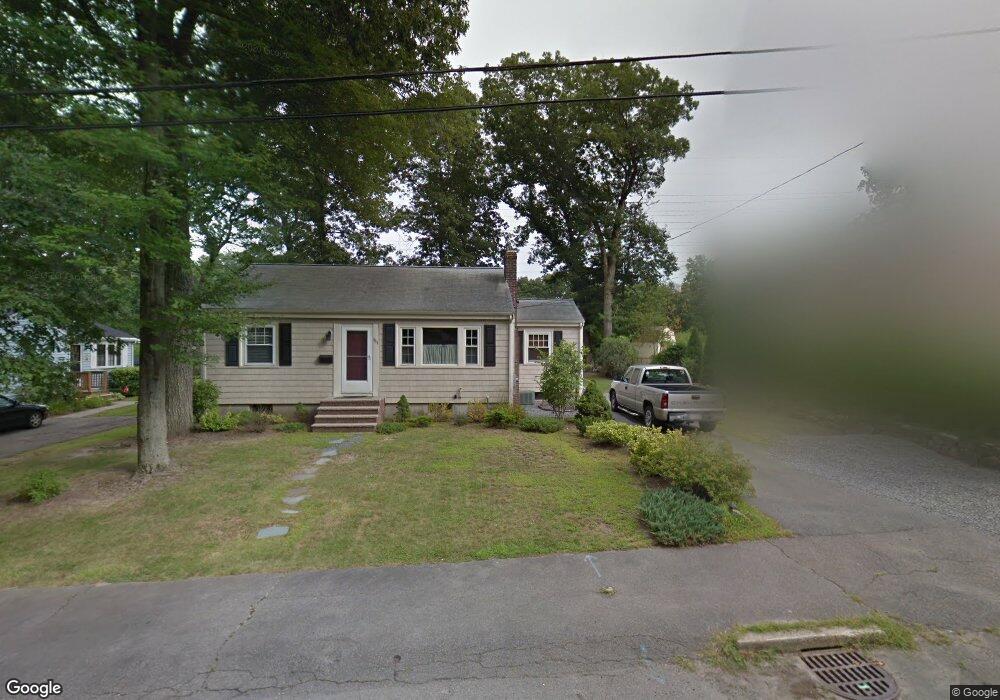
111 Belmont St Weymouth, MA 02188
South Weymouth NeighborhoodEstimated Value: $602,670 - $628,000
3
Beds
1
Bath
1,227
Sq Ft
$501/Sq Ft
Est. Value
About This Home
This home is located at 111 Belmont St, Weymouth, MA 02188 and is currently estimated at $614,418, approximately $500 per square foot. 111 Belmont St is a home located in Norfolk County with nearby schools including Frederick C Murphy, Abigail Adams Middle School, and Weymouth Middle School Chapman.
Ownership History
Date
Name
Owned For
Owner Type
Purchase Details
Closed on
Jan 4, 2017
Sold by
Callahan Catherine F
Bought by
111 Belmont Street Rt
Current Estimated Value
Purchase Details
Closed on
Oct 26, 2011
Sold by
Callahan Jeanine M
Bought by
Callahan Paul F
Purchase Details
Closed on
May 23, 2011
Sold by
Callahan Jeanine F
Bought by
Callahan Paul F
Purchase Details
Closed on
Apr 13, 1994
Sold by
Callahan Paul F
Bought by
Fowler Jeanine M
Create a Home Valuation Report for This Property
The Home Valuation Report is an in-depth analysis detailing your home's value as well as a comparison with similar homes in the area
Home Values in the Area
Average Home Value in this Area
Purchase History
| Date | Buyer | Sale Price | Title Company |
|---|---|---|---|
| 111 Belmont Street Rt | -- | -- | |
| Callahan Paul F | -- | -- | |
| Callahan Paul F | -- | -- | |
| Callahan Paul F | -- | -- | |
| Fowler Jeanine M | $66,666 | -- |
Source: Public Records
Tax History Compared to Growth
Tax History
| Year | Tax Paid | Tax Assessment Tax Assessment Total Assessment is a certain percentage of the fair market value that is determined by local assessors to be the total taxable value of land and additions on the property. | Land | Improvement |
|---|---|---|---|---|
| 2025 | $5,314 | $526,100 | $244,600 | $281,500 |
| 2024 | $5,147 | $501,200 | $233,000 | $268,200 |
| 2023 | $4,900 | $468,900 | $215,800 | $253,100 |
| 2022 | $4,646 | $405,400 | $183,100 | $222,300 |
| 2021 | $4,329 | $368,700 | $183,100 | $185,600 |
| 2020 | $4,164 | $349,300 | $183,100 | $166,200 |
| 2019 | $3,985 | $328,800 | $176,100 | $152,700 |
| 2018 | $3,866 | $309,300 | $167,700 | $141,600 |
| 2017 | $3,798 | $296,500 | $159,700 | $136,800 |
| 2016 | $3,625 | $283,200 | $153,600 | $129,600 |
| 2015 | $3,412 | $264,500 | $146,600 | $117,900 |
| 2014 | $3,330 | $250,400 | $136,400 | $114,000 |
Source: Public Records
Map
Nearby Homes
- 116 Belmont St
- 501 Commerce Dr Unit 2310
- 501 Commerce Dr Unit 1111
- 501 Commerce Dr Unit 4206
- 501 Commerce Dr Unit 4308
- 501 Commerce Dr Unit 4306
- 200 Justin Dr Unit 3
- 655 Summer St
- 255 West St
- 262 West St
- 92 Mercury St
- 2 Tara Dr Unit 1
- 432 Grove St
- 441 Grove St
- 48 Apple Tree Ln
- 54 Federal St
- 24 Blake Rd
- 2 Mitchell Ln Unit B
- 308 Forest St
- 16 Jay Rd