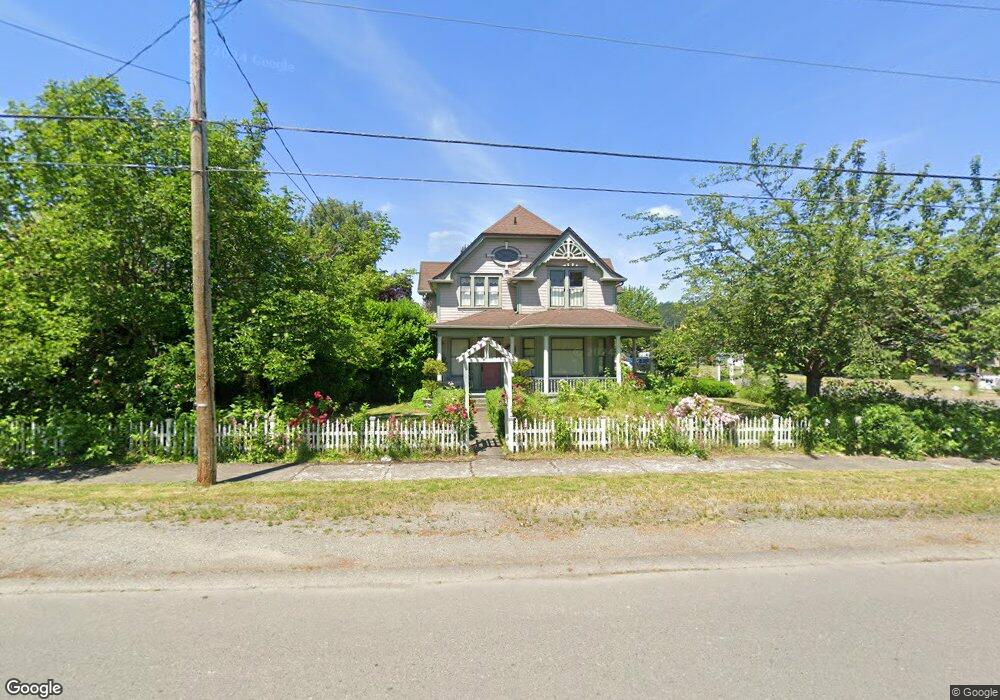
111 Bridge St SE Orting, WA 98360
Estimated Value: $527,688 - $599,000
3
Beds
1
Bath
2,347
Sq Ft
$239/Sq Ft
Est. Value
About This Home
This home is located at 111 Bridge St SE, Orting, WA 98360 and is currently estimated at $561,922, approximately $239 per square foot. 111 Bridge St SE is a home with nearby schools including Orting Elementary School, Ptarmigan Ridge Elementary School, and Orting Middle School.
Ownership History
Date
Name
Owned For
Owner Type
Purchase Details
Closed on
Oct 26, 2016
Sold by
Rogers Michael Jon
Bought by
Rogers Belisa Mae
Current Estimated Value
Create a Home Valuation Report for This Property
The Home Valuation Report is an in-depth analysis detailing your home's value as well as a comparison with similar homes in the area
Home Values in the Area
Average Home Value in this Area
Purchase History
| Date | Buyer | Sale Price | Title Company |
|---|---|---|---|
| Rogers Belisa Mae | -- | None Available |
Source: Public Records
Tax History
| Year | Tax Paid | Tax Assessment Tax Assessment Total Assessment is a certain percentage of the fair market value that is determined by local assessors to be the total taxable value of land and additions on the property. | Land | Improvement |
|---|---|---|---|---|
| 2025 | $4,052 | $471,700 | $213,500 | $258,200 |
| 2024 | $4,052 | $470,700 | $202,200 | $268,500 |
| 2023 | $4,052 | $437,000 | $193,200 | $243,800 |
| 2022 | $4,343 | $452,200 | $193,200 | $259,000 |
| 2021 | $4,306 | $355,800 | $128,600 | $227,200 |
| 2019 | $3,909 | $320,600 | $109,100 | $211,500 |
| 2018 | $4,024 | $303,500 | $95,100 | $208,400 |
| 2017 | $3,056 | $267,000 | $76,400 | $190,600 |
| 2016 | $2,811 | $182,100 | $62,100 | $120,000 |
| 2014 | $2,340 | $167,800 | $55,500 | $112,300 |
| 2013 | $2,340 | $138,500 | $43,600 | $94,900 |
Source: Public Records
Map
Nearby Homes
- 304 Varner Ave SE
- 411 Hardefeldt St SE
- 121 van Scoyoc Ave SW
- 213 Bridge St SW
- 211 Bridge St SW
- 120 Corrin Ave NW
- 201 River Ave NE
- 215 Corrin Ave NW Unit C
- 215 Corrin Ave NW Unit B
- 215 Corrin Ave NW Unit D
- 215 Corrin Ave NW Unit A
- 103 Harrison Ln SE Unit 1-4
- 316 Bowlin Ave NE
- 310 Orting Ave NW
- 317 Icey St SW
- 836 Harman Way S Unit 73
- 103 Balmer St SW
- 204 Balmer St SW
- 716 Teetor Cir NW Unit Lot 08
- 718 Teetor Cir NW Unit LOT 9
- 227 Varner Ave SE Unit A-F
- 227 Varner Ave SE
- 227 Varner Ave SE Unit C
- 215 Varner Ave SE
- 116 Bridge St SE
- 110 Bridge St SE
- 216 Varner Ave SE
- 228 Varner Ave SE
- 216 Varner Ave SE
- 224 Washington Ave S
- 214 Varner Ave SE
- 211 Varner Ave SE
- 108 Bridge St SE
- 220 Washington Ave S
- 220 Washington Ave N
- 212 Varner Ave SE
- 209 Varner St SE
- 216 Washington Ave S
- 309 Varner Ave SE
Your Personal Tour Guide
Ask me questions while you tour the home.