Estimated Value: $334,930 - $354,000
4
Beds
4
Baths
2,580
Sq Ft
$133/Sq Ft
Est. Value
About This Home
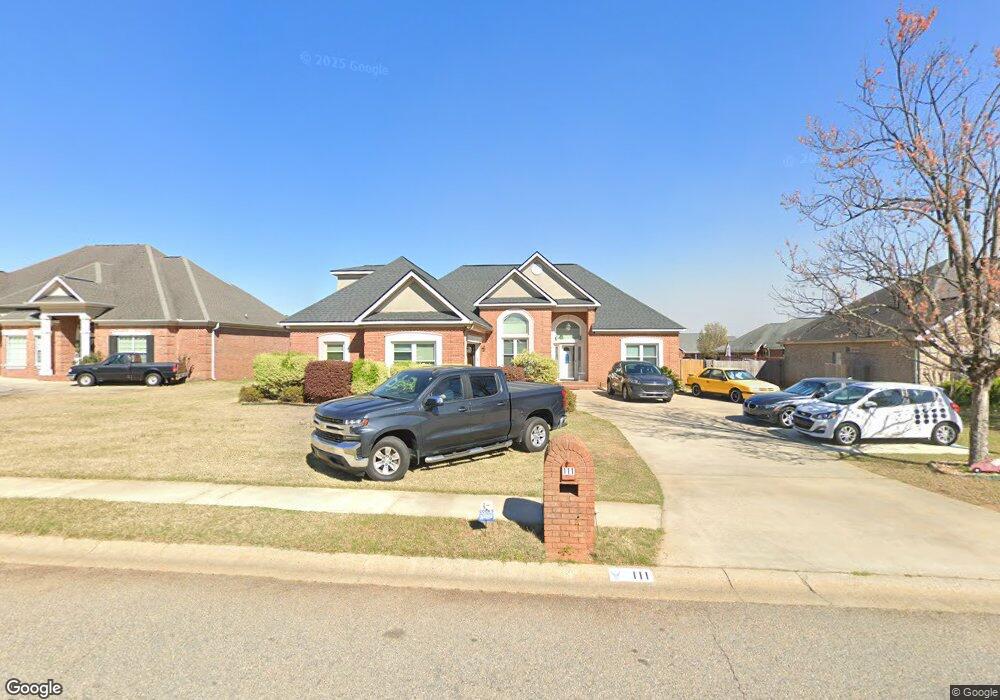
This home is located at 111 Caleb Way, Byron, GA 31008 and is currently estimated at $343,483, approximately $133 per square foot. 111 Caleb Way is a home located in Peach County with nearby schools including Byron Elementary School, Byron Middle School, and Peach County High School.
Ownership History
Date
Name
Owned For
Owner Type
Purchase Details
Closed on
Sep 23, 2011
Sold by
Household Realty Company
Bought by
Musgrave Jim A and Musgrave Teresa L
Current Estimated Value
Home Financials for this Owner
Home Financials are based on the most recent Mortgage that was taken out on this home.
Original Mortgage
$171,374
Outstanding Balance
$117,580
Interest Rate
4.3%
Mortgage Type
VA
Estimated Equity
$225,903
Purchase Details
Closed on
Jun 1, 2011
Sold by
Floyd Mortimer
Bought by
Household Realty Corporation
Purchase Details
Closed on
Aug 21, 2005
Sold by
Bayside Builders Inc
Bought by
Floyd Mortimer K and Floyd Shemeka
Home Financials for this Owner
Home Financials are based on the most recent Mortgage that was taken out on this home.
Original Mortgage
$219,000
Interest Rate
9.35%
Mortgage Type
New Conventional
Purchase Details
Closed on
Apr 2, 2004
Sold by
Newton Development Llc
Bought by
Bayside Builders Inc
Create a Home Valuation Report for This Property
The Home Valuation Report is an in-depth analysis detailing your home's value as well as a comparison with similar homes in the area
Home Values in the Area
Average Home Value in this Area
Purchase History
| Date | Buyer | Sale Price | Title Company |
|---|---|---|---|
| Musgrave Jim A | $165,900 | -- | |
| Household Realty Corporation | -- | -- | |
| Floyd Mortimer K | $219,000 | -- | |
| Bayside Builders Inc | $22,000 | -- |
Source: Public Records
Mortgage History
| Date | Status | Borrower | Loan Amount |
|---|---|---|---|
| Open | Musgrave Jim A | $171,374 | |
| Previous Owner | Floyd Mortimer K | $219,000 |
Source: Public Records
Tax History Compared to Growth
Tax History
| Year | Tax Paid | Tax Assessment Tax Assessment Total Assessment is a certain percentage of the fair market value that is determined by local assessors to be the total taxable value of land and additions on the property. | Land | Improvement |
|---|---|---|---|---|
| 2024 | $4,367 | $123,880 | $12,480 | $111,400 |
| 2023 | $4,324 | $121,880 | $10,000 | $111,880 |
| 2022 | $2,775 | $105,080 | $7,000 | $98,080 |
| 2021 | $2,723 | $89,200 | $7,000 | $82,200 |
| 2020 | $2,616 | $85,800 | $7,000 | $78,800 |
| 2019 | $2,629 | $85,800 | $7,000 | $78,800 |
| 2018 | $2,643 | $85,800 | $7,000 | $78,800 |
| 2017 | $2,332 | $75,600 | $7,000 | $68,600 |
| 2016 | $2,322 | $75,600 | $7,000 | $68,600 |
| 2015 | $2,326 | $75,600 | $7,000 | $68,600 |
| 2014 | $2,548 | $82,480 | $7,000 | $75,480 |
| 2013 | -- | $82,480 | $7,000 | $75,480 |
Source: Public Records
Map
Nearby Homes
- 109 Caleb Way
- 113 Caleb Way
- 114 Carrington Ln
- 112 Carrington Ln
- 107 Caleb Way
- 116 Carrington Ln
- 115 Caleb Way
- 120 Caleb Way
- 118 Caleb Way
- 110 Carrington Ln
- 122 Caleb Way
- 116 Caleb Way
- 105 Caleb Way
- 124 Caleb Way
- 114 Caleb Way
- 108 Carrington Ln
- 123 Manchester Ln
- 121 Manchester Ln
- 113 Carrington Ln
- 125 Manchester Ln