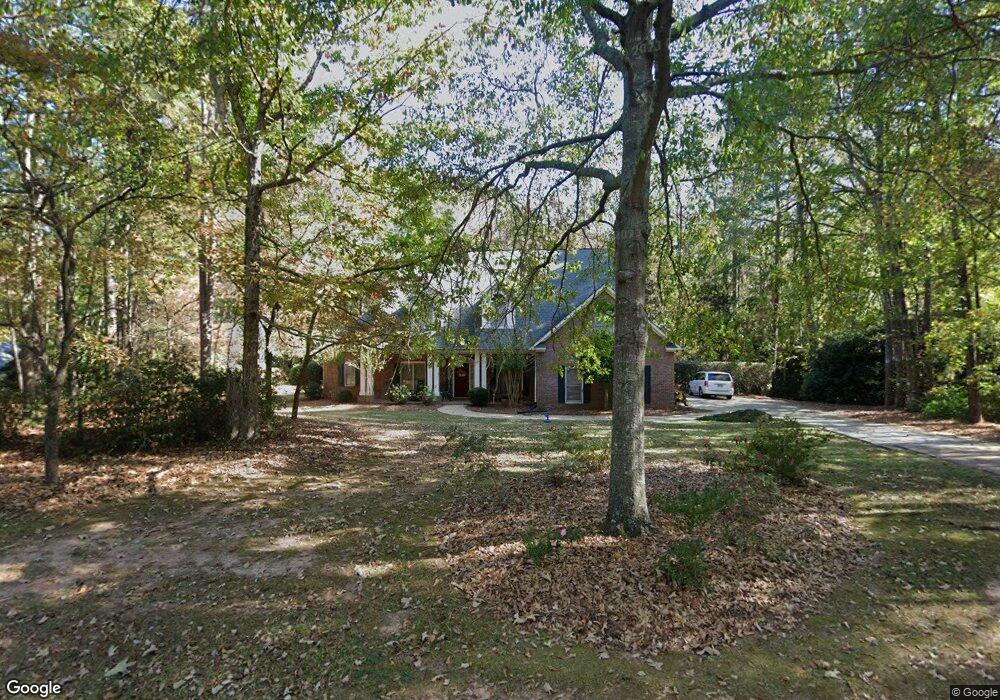
111 Cameron Pointe Dr Lagrange, GA 30240
Estimated Value: $455,000 - $494,000
5
Beds
4
Baths
3,196
Sq Ft
$149/Sq Ft
Est. Value
About This Home
This home is located at 111 Cameron Pointe Dr, Lagrange, GA 30240 and is currently estimated at $475,055, approximately $148 per square foot. 111 Cameron Pointe Dr is a home located in Troup County with nearby schools including Hillcrest Elementary School, Franklin Forest Elementary School, and Hollis Hand Elementary School.
Ownership History
Date
Name
Owned For
Owner Type
Purchase Details
Closed on
Nov 15, 2019
Sold by
Slater Thomas Urlin
Bought by
Higgins Jeffrey G and Higgins Jamie H
Current Estimated Value
Home Financials for this Owner
Home Financials are based on the most recent Mortgage that was taken out on this home.
Original Mortgage
$261,250
Outstanding Balance
$226,633
Interest Rate
3.6%
Mortgage Type
New Conventional
Estimated Equity
$248,422
Purchase Details
Closed on
Apr 16, 2008
Sold by
Key R Michael
Bought by
Slater Thomas Urlin and Slater Doris Ann
Home Financials for this Owner
Home Financials are based on the most recent Mortgage that was taken out on this home.
Original Mortgage
$200,000
Interest Rate
5.26%
Mortgage Type
New Conventional
Purchase Details
Closed on
Sep 23, 1994
Sold by
Dan-Ric Inc
Bought by
Key R Michael
Purchase Details
Closed on
Apr 19, 1988
Sold by
Margaret E Sheckels
Bought by
Dan-Ric Inc
Create a Home Valuation Report for This Property
The Home Valuation Report is an in-depth analysis detailing your home's value as well as a comparison with similar homes in the area
Purchase History
| Date | Buyer | Sale Price | Title Company |
|---|---|---|---|
| Higgins Jeffrey G | $275,000 | -- | |
| Slater Thomas Urlin | $351,500 | -- | |
| Key R Michael | $30,000 | -- | |
| Dan-Ric Inc | -- | -- |
Source: Public Records
Mortgage History
| Date | Status | Borrower | Loan Amount |
|---|---|---|---|
| Open | Higgins Jeffrey G | $261,250 | |
| Previous Owner | Slater Thomas Urlin | $200,000 |
Source: Public Records
Tax History
| Year | Tax Paid | Tax Assessment Tax Assessment Total Assessment is a certain percentage of the fair market value that is determined by local assessors to be the total taxable value of land and additions on the property. | Land | Improvement |
|---|---|---|---|---|
| 2025 | $4,571 | $167,600 | $18,000 | $149,600 |
| 2024 | $4,369 | $160,200 | $18,000 | $142,200 |
| 2023 | $4,310 | $158,040 | $18,000 | $140,040 |
| 2022 | $3,844 | $137,720 | $18,000 | $119,720 |
| 2021 | $3,347 | $110,960 | $14,000 | $96,960 |
| 2020 | $3,318 | $110,960 | $14,000 | $96,960 |
| 2019 | $3,338 | $118,440 | $14,000 | $104,440 |
| 2018 | $3,512 | $118,440 | $14,000 | $104,440 |
| 2017 | $3,512 | $118,440 | $14,000 | $104,440 |
| 2016 | $3,588 | $120,946 | $14,000 | $106,946 |
| 2015 | $3,600 | $121,134 | $14,000 | $107,134 |
| 2014 | $3,444 | $115,777 | $14,000 | $101,777 |
| 2013 | -- | $112,788 | $14,000 | $98,788 |
Source: Public Records
Map
Nearby Homes
- 107 Cameron Pointe Dr
- 102 Cameron Pointe Dr
- 300 Willow Pointe Dr
- 302 Willow Pointe Dr
- 348 Willow Pointe Dr
- 206 Sturbridge Dr
- 1206 the Reserve
- 135 Copper Creek Dr
- 2010 Foxcroft Dr
- 219 E Yorktown Dr
- 120 Copper Creek Dr
- 2005 Foxcroft Dr
- 14 Firefly Run
- 56 Firefly Run
- 96 Firefly Run
- 5 Firefly Run
- 110 Firefly Run
- 116 Firefly Run
- 178 Wolf Creek Cove
- 64 Waterview Ct
- 109 Cameron Pointe Dr
- 109 Cameron Pointe Dr
- 113 Cameron Pointe Dr
- 113 Cameron Point
- 110 Cameron Pointe Dr
- 108 Cameron Pointe Dr
- 108 Cameron Pointe Dr
- 115 Cameron Pointe Dr Unit 15
- 115 Cameron Pointe Dr
- 106 Cameron Pointe Dr
- 112 Cameron Pointe Dr
- 117 Cameron Pointe Dr
- 104 Cameron Pointe Dr
- 105 Cameron Pointe Dr
- 119 Cameron Pointe Dr
- 114 Cameron Pointe Dr
- 105 Cameron Pointe Ct
- 103 Cameron Pointe Dr
- 103 Cameron Pointe Ct
- 116 Cameron Pointe Dr
Your Personal Tour Guide
Ask me questions while you tour the home.