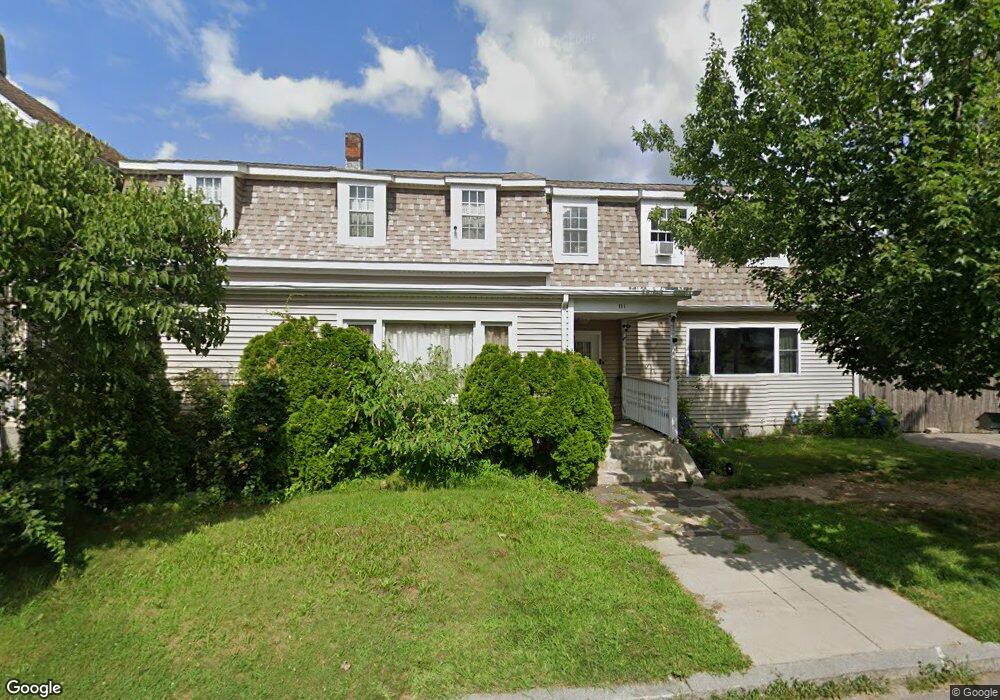
111 Carl St Fall River, MA 02721
Maplewood NeighborhoodEstimated Value: $477,672 - $784,000
6
Beds
4
Baths
3,722
Sq Ft
$163/Sq Ft
Est. Value
About This Home
This home is located at 111 Carl St, Fall River, MA 02721 and is currently estimated at $607,918, approximately $163 per square foot. 111 Carl St is a home located in Bristol County with nearby schools including Letourneau Elementary School, Matthew J. Kuss Middle School, and B M C Durfee High School.
Ownership History
Date
Name
Owned For
Owner Type
Purchase Details
Closed on
Jul 8, 2010
Sold by
Falcon Rachel A and Defreslon Rachel A
Bought by
Falcon Ronald and Falcon Dianne P
Current Estimated Value
Purchase Details
Closed on
Sep 17, 2003
Sold by
Falcon Dianne P and Falcon Ronald
Bought by
Falcon Dianne P and Defreslon Jerome M
Purchase Details
Closed on
Nov 15, 1978
Bought by
Falcon Ronald and Falcon Dianne P
Create a Home Valuation Report for This Property
The Home Valuation Report is an in-depth analysis detailing your home's value as well as a comparison with similar homes in the area
Home Values in the Area
Average Home Value in this Area
Purchase History
| Date | Buyer | Sale Price | Title Company |
|---|---|---|---|
| Falcon Ronald | -- | -- | |
| Falcon Dianne P | -- | -- | |
| Falcon Ronald | $18,000 | -- |
Source: Public Records
Mortgage History
| Date | Status | Borrower | Loan Amount |
|---|---|---|---|
| Previous Owner | Falcon Ronald | $60,000 | |
| Previous Owner | Falcon Ronald | $58,000 | |
| Previous Owner | Falcon Ronald | $15,755 |
Source: Public Records
Tax History
| Year | Tax Paid | Tax Assessment Tax Assessment Total Assessment is a certain percentage of the fair market value that is determined by local assessors to be the total taxable value of land and additions on the property. | Land | Improvement |
|---|---|---|---|---|
| 2025 | $4,353 | $380,200 | $131,600 | $248,600 |
| 2024 | $4,309 | $375,000 | $126,600 | $248,400 |
| 2023 | $4,548 | $370,700 | $108,600 | $262,100 |
| 2022 | $4,553 | $360,800 | $98,700 | $262,100 |
| 2021 | $4,235 | $306,200 | $91,300 | $214,900 |
| 2020 | $3,871 | $267,900 | $87,400 | $180,500 |
| 2019 | $3,845 | $263,700 | $83,200 | $180,500 |
| 2018 | $3,773 | $258,100 | $81,700 | $176,400 |
| 2017 | $3,636 | $259,700 | $83,300 | $176,400 |
| 2016 | $3,564 | $261,500 | $86,800 | $174,700 |
| 2015 | $3,388 | $259,000 | $83,600 | $175,400 |
| 2014 | $3,314 | $263,400 | $88,000 | $175,400 |
Source: Public Records
Map
Nearby Homes
Your Personal Tour Guide
Ask me questions while you tour the home.