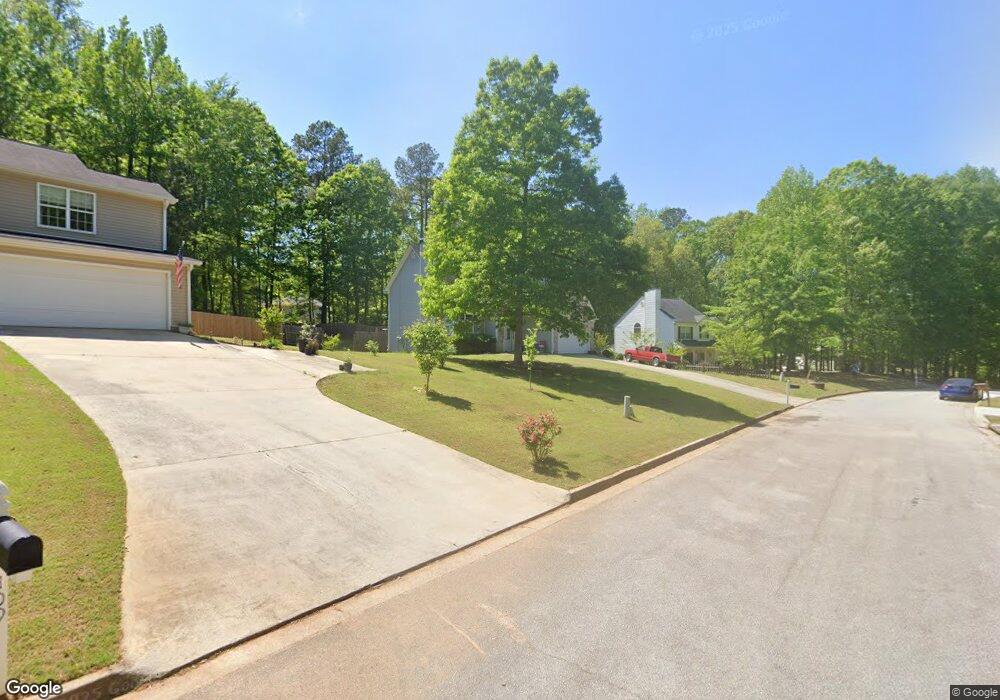
111 Chapleau Ln Griffin, GA 30223
Spalding County NeighborhoodEstimated Value: $237,000 - $292,000
5
Beds
3
Baths
2,067
Sq Ft
$124/Sq Ft
Est. Value
About This Home
This home is located at 111 Chapleau Ln, Griffin, GA 30223 and is currently estimated at $256,788, approximately $124 per square foot. 111 Chapleau Ln is a home located in Spalding County with nearby schools including Cowan Road Elementary School, Cowan Road Middle School, and Griffin High School.
Ownership History
Date
Name
Owned For
Owner Type
Purchase Details
Closed on
Dec 23, 2019
Sold by
Thomas Justin D
Bought by
Jackson Temisha S
Current Estimated Value
Home Financials for this Owner
Home Financials are based on the most recent Mortgage that was taken out on this home.
Original Mortgage
$152,093
Outstanding Balance
$133,827
Interest Rate
3.5%
Mortgage Type
FHA
Estimated Equity
$122,961
Purchase Details
Closed on
Jul 20, 2011
Sold by
Aurora Ln Svcs Llc
Bought by
Thomas Justin D
Home Financials for this Owner
Home Financials are based on the most recent Mortgage that was taken out on this home.
Original Mortgage
$76,022
Interest Rate
4.37%
Mortgage Type
FHA
Purchase Details
Closed on
Jan 4, 2011
Sold by
Bryant Preston
Bought by
Aurora Ln Svcs Llc
Purchase Details
Closed on
Dec 9, 2005
Sold by
Village Partners Llc
Bought by
Framework For Success Inc
Purchase Details
Closed on
Aug 4, 1992
Sold by
G & S Development Ltd
Bought by
Hardrath Howard Robert
Create a Home Valuation Report for This Property
The Home Valuation Report is an in-depth analysis detailing your home's value as well as a comparison with similar homes in the area
Home Values in the Area
Average Home Value in this Area
Purchase History
| Date | Buyer | Sale Price | Title Company |
|---|---|---|---|
| Jackson Temisha S | $154,900 | -- | |
| Thomas Justin D | $78,000 | -- | |
| Aurora Ln Svcs Llc | $147,482 | -- | |
| Framework For Success Inc | $56,400 | -- | |
| Hardrath Howard Robert | -- | -- |
Source: Public Records
Mortgage History
| Date | Status | Borrower | Loan Amount |
|---|---|---|---|
| Open | Jackson Temisha S | $152,093 | |
| Previous Owner | Thomas Justin D | $76,022 |
Source: Public Records
Tax History Compared to Growth
Tax History
| Year | Tax Paid | Tax Assessment Tax Assessment Total Assessment is a certain percentage of the fair market value that is determined by local assessors to be the total taxable value of land and additions on the property. | Land | Improvement |
|---|---|---|---|---|
| 2024 | $2,805 | $80,225 | $12,000 | $68,225 |
| 2023 | $2,805 | $80,225 | $12,000 | $68,225 |
| 2022 | $2,413 | $68,182 | $12,000 | $56,182 |
| 2021 | $2,040 | $56,094 | $8,000 | $48,094 |
| 2020 | $2,047 | $56,094 | $8,000 | $48,094 |
| 2019 | $1,491 | $41,866 | $8,000 | $33,866 |
| 2018 | $1,414 | $38,827 | $8,000 | $30,827 |
| 2017 | $1,358 | $38,334 | $8,000 | $30,334 |
| 2016 | $1,382 | $38,334 | $8,000 | $30,334 |
| 2015 | $1,424 | $38,334 | $8,000 | $30,334 |
| 2014 | $1,453 | $38,334 | $8,000 | $30,334 |
Source: Public Records
Map
Nearby Homes
- 441 Hickory Ln
- 611A Seminole Dr
- 208 Tyler Trace
- 1527 Ridgewood Dr
- 1643 Hallmark Hills Dr
- 1652 Hallmark Hills Dr
- 313 Sammy Cir
- 1611 Hallmark Hills Dr
- 1812 W Mcintosh Rd
- 1804, 1796 W Mcintosh Rd
- 1548 Fleetwood Dr
- 115 1st Ave
- 4038 W Mcintosh Rd
- 310 Sunset Dr
- 2347 W Mcintosh Rd
- 1807 Ridge St
- 4920 Fayetteville Rd
- 4940 Fayetteville Rd
- 4946 Fayetteville Rd
- 101 Lexington Place Dr
- 109 Chapleau Ln
- 0 Chapleau Ln
- 1326 Cowan Rd
- 113 Chapleau Ln
- 1324 Cowan Rd
- 107 Chapleau Ln
- 101 Valley Ct
- 110 Chapleau Ln
- 102 Sherbrooke Way
- 104 Sherbrooke Way
- 1328 Cowan Rd
- 105 Chapleau Ln
- 112 Chapleau Ln
- 100 Sherbrooke Way
- 0 Valley Ct Unit 7392647
- 0 Valley Ct Unit 8393831
- 103 Biencourt Dr
- 100 Valley Ct
- 100 Valley Ct
- 105 Valley Ct