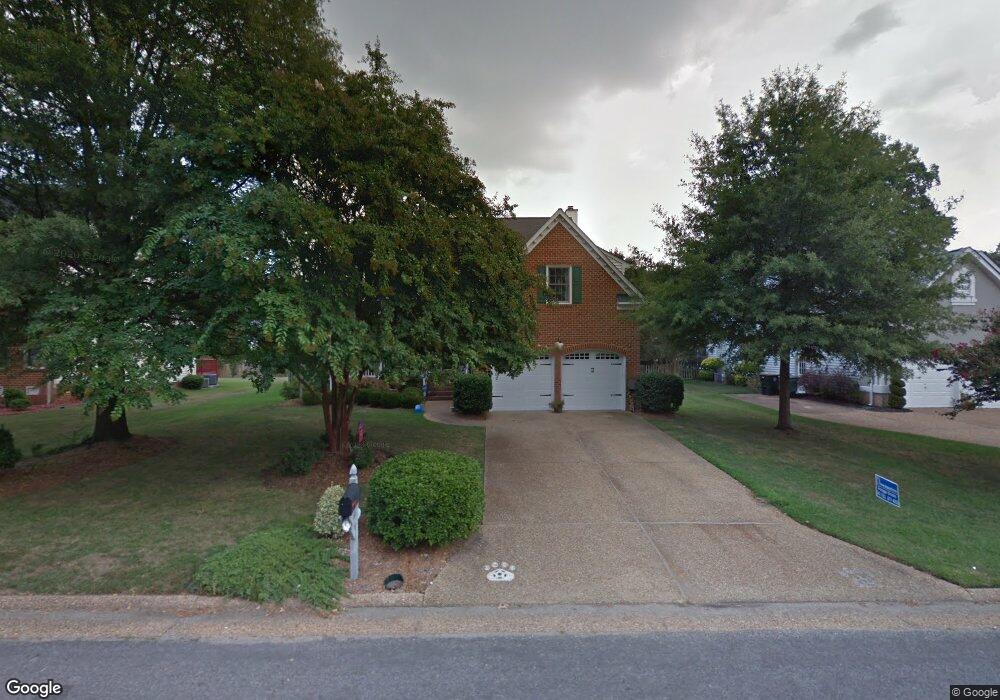
111 Chris Slade Chase Yorktown, VA 23693
Tabb NeighborhoodEstimated Value: $600,444 - $660,000
4
Beds
3
Baths
2,600
Sq Ft
$241/Sq Ft
Est. Value
About This Home
This home is located at 111 Chris Slade Chase, Yorktown, VA 23693 and is currently estimated at $625,861, approximately $240 per square foot. 111 Chris Slade Chase is a home located in York County with nearby schools including Tabb Elementary School, Tabb Middle School, and Tabb High School.
Ownership History
Date
Name
Owned For
Owner Type
Purchase Details
Closed on
May 17, 2017
Sold by
Williams Dalton F and Williams Rosa M
Bought by
Sisson David G and Prestigiacomo Kristen M
Current Estimated Value
Home Financials for this Owner
Home Financials are based on the most recent Mortgage that was taken out on this home.
Original Mortgage
$389,500
Outstanding Balance
$307,487
Interest Rate
2.38%
Mortgage Type
New Conventional
Estimated Equity
$318,374
Purchase Details
Closed on
Jul 28, 2009
Sold by
Davis Keith W
Bought by
Williams Dalton F
Home Financials for this Owner
Home Financials are based on the most recent Mortgage that was taken out on this home.
Original Mortgage
$408,600
Interest Rate
5.43%
Mortgage Type
New Conventional
Purchase Details
Closed on
Jul 26, 2000
Sold by
O'Boyle Michael E
Bought by
Davis Kenneth W
Home Financials for this Owner
Home Financials are based on the most recent Mortgage that was taken out on this home.
Original Mortgage
$174,320
Interest Rate
8.18%
Create a Home Valuation Report for This Property
The Home Valuation Report is an in-depth analysis detailing your home's value as well as a comparison with similar homes in the area
Home Values in the Area
Average Home Value in this Area
Purchase History
| Date | Buyer | Sale Price | Title Company |
|---|---|---|---|
| Sisson David G | $410,000 | Stewart Title Guaranty Co | |
| Williams Dalton F | $400,000 | -- | |
| Davis Kenneth W | $217,900 | -- |
Source: Public Records
Mortgage History
| Date | Status | Borrower | Loan Amount |
|---|---|---|---|
| Open | Sisson David G | $389,500 | |
| Previous Owner | Williams Dalton F | $408,600 | |
| Previous Owner | Davis Kenneth W | $174,320 |
Source: Public Records
Tax History Compared to Growth
Tax History
| Year | Tax Paid | Tax Assessment Tax Assessment Total Assessment is a certain percentage of the fair market value that is determined by local assessors to be the total taxable value of land and additions on the property. | Land | Improvement |
|---|---|---|---|---|
| 2025 | $3,840 | $518,900 | $136,000 | $382,900 |
| 2024 | $3,840 | $518,900 | $136,000 | $382,900 |
| 2023 | $3,291 | $427,400 | $136,000 | $291,400 |
| 2022 | $3,334 | $427,400 | $136,000 | $291,400 |
| 2021 | $3,102 | $390,200 | $136,000 | $254,200 |
| 2020 | $3,102 | $390,200 | $136,000 | $254,200 |
| 2019 | $4,488 | $393,700 | $136,000 | $257,700 |
| 2018 | $4,488 | $393,700 | $136,000 | $257,700 |
| 2017 | $2,874 | $382,400 | $136,000 | $246,400 |
| 2016 | $2,874 | $382,400 | $136,000 | $246,400 |
| 2015 | -- | $377,500 | $136,000 | $241,500 |
| 2014 | -- | $377,500 | $136,000 | $241,500 |
Source: Public Records
Map
Nearby Homes
- 105 Chris Slade Chase
- 508 Carys Chapel Rd
- 135 Trawler Trip
- 137 Trawler Trip
- 500 Carys Chapel Rd
- 106 Trawler Trip
- 102 Oxford Run
- 329 Waterman's Way
- 321 Waterman's Way
- 319 Waterman's Way
- 331 Waterman's Way
- 313 Waterman's Way
- 323 Waterman's Way
- 305 Waterman's Way
- 317 Waterman's Way
- 327 Waterman's Way
- 307 Waterman's Way
- 309 Waterman's Way
- 325 Waterman's Way
- 328 Waterman's Way
- 109 Chris Slade Chase
- 113 Chris Slade Chase
- 117 Chris Slade Chase
- 107 Chris Slade Chase
- 207 Coach Hovis Dr
- 209 Coach Hovis Dr
- 205 Coach Hovis Dr
- 110 Chris Slade Chase
- 301 Coach Hovis Dr
- 112 Chris Slade Chase
- 119 Chris Slade Chase
- 108 Chris Slade Chase
- 114 Chris Slade Chase
- 303 Coach Hovis Dr
- 116 Chris Slade Chase
- 106 Chris Slade Chase
- 305 Coach Hovis Dr
- 109 Coach Hovis Dr
- 307 Coach Hovis Dr
- 104 Chris Slade Chase