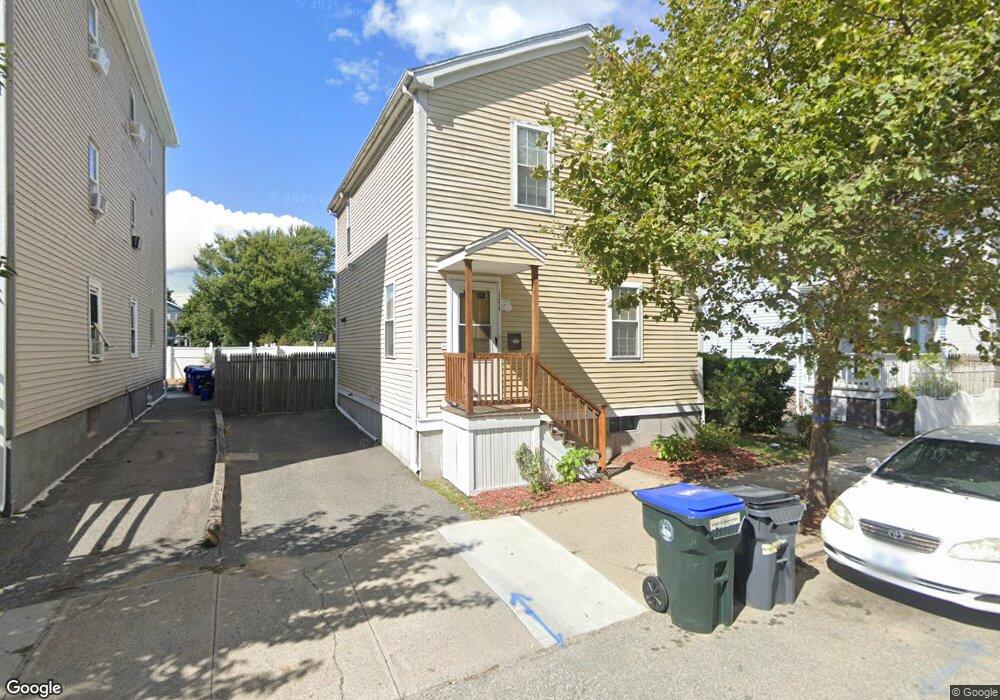
111 Colfax St Providence, RI 02905
Lower South Providence NeighborhoodEstimated Value: $367,000 - $412,000
3
Beds
2
Baths
1,232
Sq Ft
$317/Sq Ft
Est. Value
About This Home
This home is located at 111 Colfax St, Providence, RI 02905 and is currently estimated at $390,291, approximately $316 per square foot. 111 Colfax St is a home located in Providence County with nearby schools including Asa Messer Elementary School, Charles N. Fortes Elementary School, and Robert L. Bailey IV Elementary.
Ownership History
Date
Name
Owned For
Owner Type
Purchase Details
Closed on
Oct 23, 2025
Sold by
Gant Diana M
Bought by
George Samuel
Current Estimated Value
Purchase Details
Closed on
Jun 27, 2003
Sold by
Swap Inc
Bought by
Gant Diana M
Home Financials for this Owner
Home Financials are based on the most recent Mortgage that was taken out on this home.
Original Mortgage
$89,240
Interest Rate
5.53%
Mortgage Type
Purchase Money Mortgage
Purchase Details
Closed on
Apr 26, 1999
Sold by
Rivera Ivonne and Couto Raul A
Bought by
Ri Housing & Mtg Fin
Purchase Details
Closed on
Jan 16, 1996
Sold by
Estrella Dulce
Bought by
Rivera Ivonne and Couto Raul A
Home Financials for this Owner
Home Financials are based on the most recent Mortgage that was taken out on this home.
Original Mortgage
$39,300
Interest Rate
7.31%
Mortgage Type
Purchase Money Mortgage
Create a Home Valuation Report for This Property
The Home Valuation Report is an in-depth analysis detailing your home's value as well as a comparison with similar homes in the area
Home Values in the Area
Average Home Value in this Area
Purchase History
| Date | Buyer | Sale Price | Title Company |
|---|---|---|---|
| George Samuel | -- | -- | |
| Gant Diana M | $92,000 | -- | |
| Ri Housing & Mtg Fin | $27,000 | -- | |
| Rivera Ivonne | $45,000 | -- |
Source: Public Records
Mortgage History
| Date | Status | Borrower | Loan Amount |
|---|---|---|---|
| Previous Owner | Rivera Ivonne | $89,240 | |
| Previous Owner | Rivera Ivonne | $2,500 | |
| Previous Owner | Rivera Ivonne | $39,300 |
Source: Public Records
Tax History Compared to Growth
Tax History
| Year | Tax Paid | Tax Assessment Tax Assessment Total Assessment is a certain percentage of the fair market value that is determined by local assessors to be the total taxable value of land and additions on the property. | Land | Improvement |
|---|---|---|---|---|
| 2025 | $3,048 | $362,900 | $118,500 | $244,400 |
| 2024 | $5,000 | $272,500 | $75,100 | $197,400 |
| 2023 | $5,000 | $272,500 | $75,100 | $197,400 |
| 2022 | $4,851 | $272,500 | $75,100 | $197,400 |
| 2021 | $4,269 | $173,800 | $33,100 | $140,700 |
| 2020 | $4,269 | $173,800 | $33,100 | $140,700 |
| 2019 | $4,269 | $173,800 | $33,100 | $140,700 |
| 2018 | $3,899 | $122,000 | $30,100 | $91,900 |
| 2017 | $3,899 | $122,000 | $30,100 | $91,900 |
| 2016 | $3,899 | $122,000 | $30,100 | $91,900 |
| 2015 | $3,979 | $120,200 | $30,100 | $90,100 |
| 2014 | $4,057 | $120,200 | $30,100 | $90,100 |
| 2013 | $4,057 | $120,200 | $30,100 | $90,100 |
Source: Public Records
Map
Nearby Homes