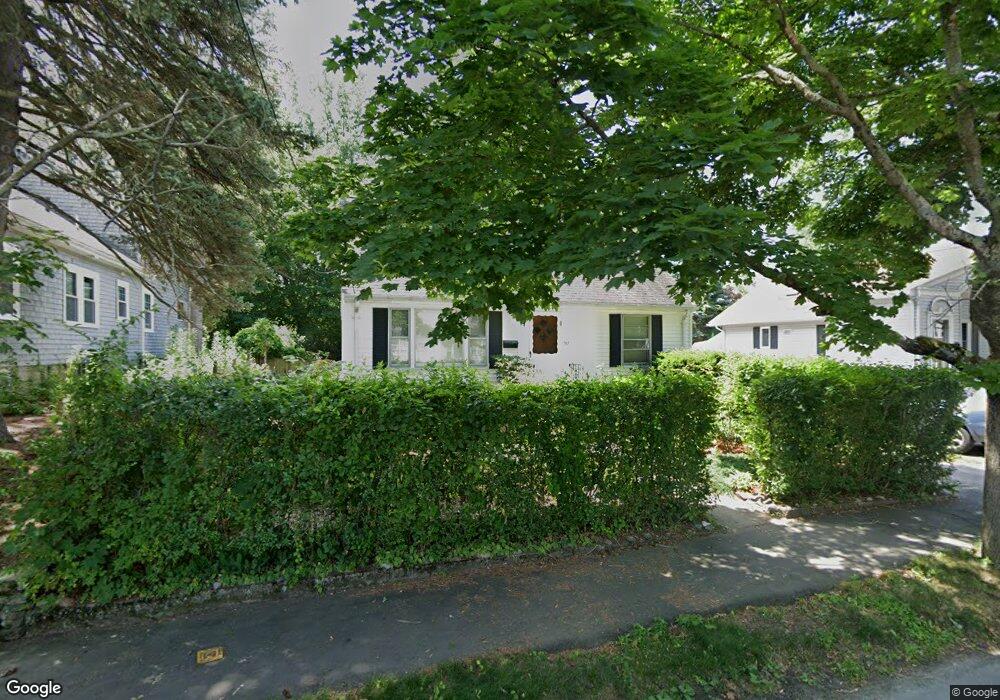
111 Commonwealth Ave Dedham, MA 02026
Riverdale NeighborhoodEstimated Value: $609,000 - $678,000
3
Beds
1
Bath
1,092
Sq Ft
$581/Sq Ft
Est. Value
About This Home
This home is located at 111 Commonwealth Ave, Dedham, MA 02026 and is currently estimated at $634,258, approximately $580 per square foot. 111 Commonwealth Ave is a home located in Norfolk County with nearby schools including Riverdale Elementary School, Dedham Middle School, and Dedham High School.
Ownership History
Date
Name
Owned For
Owner Type
Purchase Details
Closed on
Sep 18, 2003
Sold by
Glennie Matthew and Glennie Jacqueline
Bought by
Lynch Scott and Browning Kerry A
Current Estimated Value
Home Financials for this Owner
Home Financials are based on the most recent Mortgage that was taken out on this home.
Original Mortgage
$287,100
Outstanding Balance
$133,827
Interest Rate
6.31%
Mortgage Type
Purchase Money Mortgage
Estimated Equity
$500,431
Purchase Details
Closed on
Sep 25, 1998
Sold by
Whooley Patricia J and Whooley George J
Bought by
Glennie Matthew
Home Financials for this Owner
Home Financials are based on the most recent Mortgage that was taken out on this home.
Original Mortgage
$156,150
Interest Rate
6.87%
Mortgage Type
Purchase Money Mortgage
Create a Home Valuation Report for This Property
The Home Valuation Report is an in-depth analysis detailing your home's value as well as a comparison with similar homes in the area
Home Values in the Area
Average Home Value in this Area
Purchase History
| Date | Buyer | Sale Price | Title Company |
|---|---|---|---|
| Lynch Scott | $319,000 | -- | |
| Glennie Matthew | $173,500 | -- |
Source: Public Records
Mortgage History
| Date | Status | Borrower | Loan Amount |
|---|---|---|---|
| Open | Lynch Scott | $287,100 | |
| Previous Owner | Glennie Matthew | $156,150 |
Source: Public Records
Tax History
| Year | Tax Paid | Tax Assessment Tax Assessment Total Assessment is a certain percentage of the fair market value that is determined by local assessors to be the total taxable value of land and additions on the property. | Land | Improvement |
|---|---|---|---|---|
| 2025 | $6,903 | $547,000 | $311,700 | $235,300 |
| 2024 | $6,714 | $537,100 | $282,800 | $254,300 |
| 2023 | $6,324 | $492,500 | $256,100 | $236,400 |
| 2022 | $5,966 | $446,900 | $240,500 | $206,400 |
| 2021 | $5,465 | $399,800 | $222,700 | $177,100 |
| 2020 | $5,477 | $399,200 | $222,600 | $176,600 |
| 2019 | $5,070 | $358,300 | $193,600 | $164,700 |
| 2018 | $4,836 | $332,400 | $172,400 | $160,000 |
| 2017 | $4,744 | $321,400 | $161,400 | $160,000 |
| 2016 | $4,591 | $296,400 | $149,400 | $147,000 |
| 2015 | $4,356 | $274,500 | $139,700 | $134,800 |
| 2014 | $4,240 | $263,700 | $137,200 | $126,500 |
Source: Public Records
Map
Nearby Homes
- 56 Riverview St
- 45 Commonwealth Ave
- 147 Pine St
- 63 Dixon Ave
- 1515 Vfw Pkwy Unit M19
- 27 Pine St
- 75 Bingham Ave
- 50 Trimount St
- 342 Needham St
- 18 Hemlock Rd
- 17 Vogel St
- 15 Vogel St
- 41 Vogel St
- 71 Joyce Kilmer Rd
- 69 Keystone St Unit 1
- 33 Paragon Rd
- 17-31 Charles Park Rd Unit 196
- 570 Bridge St
- 115 Grove St Unit 1
- 8 Sumner St
- 109 Commonwealth Ave
- 115 Commonwealth Ave
- 105 Commonwealth Ave
- 112 Commonwealth Ave
- 116 Commonwealth Ave
- 10 Short St
- 14 Short St
- 104 Commonwealth Ave
- 104 Commonwealth Ave Unit 1
- 120 Commonwealth Ave
- 205 Bridge St
- 207 Bridge St
- 6 Short St
- 127 Commonwealth Ave Unit 1
- 9 Violet Ave
- 17 Kiely Rd
- 25 Kiely Rd
- 211 Bridge St
- 211 Bridge St Unit 1
- 20 Beacon St
Your Personal Tour Guide
Ask me questions while you tour the home.