111 Crosby St Covington, OH 45318
Covington AreaEstimated Value: $374,000 - $592,310
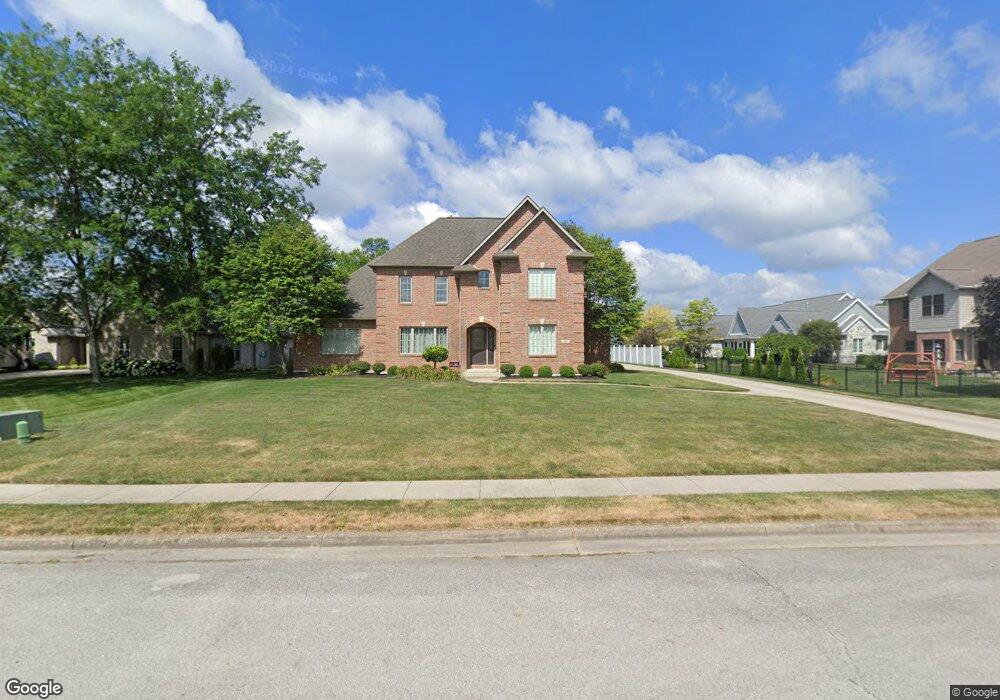
About This Home
This home is located at 111 Crosby St, Covington, OH 45318 and is currently estimated at $494,770, approximately $199 per square foot. 111 Crosby St is a home located in Miami County with nearby schools including Covington Elementary/Junior High School, Covington Junior High School, and Covington High School.
Ownership History
We collect this data history from publicly available records. To have your information removed, we recommend requesting removal directly through your county’s website.
Purchase Details
Purchase Details
Home Values in the Area
Average Home Value in this Area
Purchase History
We collect this data history from publicly available records. To have your information removed, we recommend requesting removal directly through your county’s website.
| Date | Buyer | Sale Price | Title Company |
|---|---|---|---|
| -- | None Listed On Document | ||
| $42,500 | -- |
Mortgage History
We collect this data history from publicly available records. To have your information removed, we recommend requesting removal directly through your county’s website.
| Date | Status | Borrower | Loan Amount |
|---|---|---|---|
| Previous Owner | $300,000 | ||
| Previous Owner | $4,517,000 | ||
| Previous Owner | $2,856,000 | ||
| Previous Owner | $2,800,081 | ||
| Previous Owner | $425,000 | ||
| Previous Owner | $324,000 | ||
| Previous Owner | $18,923 | ||
| Previous Owner | $21,000 | ||
| Previous Owner | $336,000 | ||
| Previous Owner | $45,000 |
Tax History
We collect this data history from publicly available records. To have your information removed, we recommend requesting removal directly through your county’s website.
| Year | Tax Paid | Tax Assessment Tax Assessment Total Assessment is a certain percentage of the fair market value that is determined by local assessors to be the total taxable value of land and additions on the property. | Land | Improvement |
|---|---|---|---|---|
| 2025 | $6,294 | $192,570 | $14,700 | $177,870 |
| 2024 | $6,294 | $121,520 | $14,700 | $106,820 |
| 2023 | $4,558 | $121,520 | $14,700 | $106,820 |
| 2022 | $4,547 | $121,520 | $14,700 | $106,820 |
| 2021 | $4,909 | $113,260 | $14,700 | $98,560 |
| 2020 | $4,578 | $113,260 | $14,700 | $98,560 |
| 2019 | $4,599 | $113,260 | $14,700 | $98,560 |
| 2018 | $4,257 | $104,620 | $15,890 | $88,730 |
| 2017 | $4,333 | $104,620 | $15,890 | $88,730 |
| 2016 | $4,277 | $104,620 | $15,890 | $88,730 |
| 2015 | $3,794 | $96,850 | $14,700 | $82,150 |
| 2014 | $3,794 | $96,850 | $14,700 | $82,150 |
| 2013 | $3,653 | $96,850 | $14,700 | $82,150 |
Map
- 312 S Wall St
- 212 Charles Ct
- 210 Charles Ct
- 205 Charles Ct
- 224 E Walnut St
- 219 Henry Ct
- 221 Henry Ct
- 223 Henry Ct
- 305 Sharon St
- 254 N Wall St
- 698 E Broadway St
- 7 S Main St
- 138 N Main St
- 7071 W State Route 41
- 731 N Pearl St
- 5310 N Rangeline Rd
- 0 W High St Unit 1044856
- 500 Lambert Dr
- 2104 Wilshire Dr
- 1626 Haverhill Dr
- 113 Crosby St
- 609 E Bridge St
- 607 E Bridge St
- 112 Crosby St
- 110 Crosby St
- 605 E Bridge St
- 107 Crosby St
- 608 E Bridge St
- 108 Crosby St
- 114 Crosby St
- 606 E Bridge St
- 106 Crosby St
- 105 Crosby St
- 206 S Wenrick St
- 604 E Bridge St
- 202 S Wenrick St
- 110 Vine St
- 104 Crosby St
- 210 S Wenrick St
- 136 S Wenrick St
Ask me questions while you tour the home.