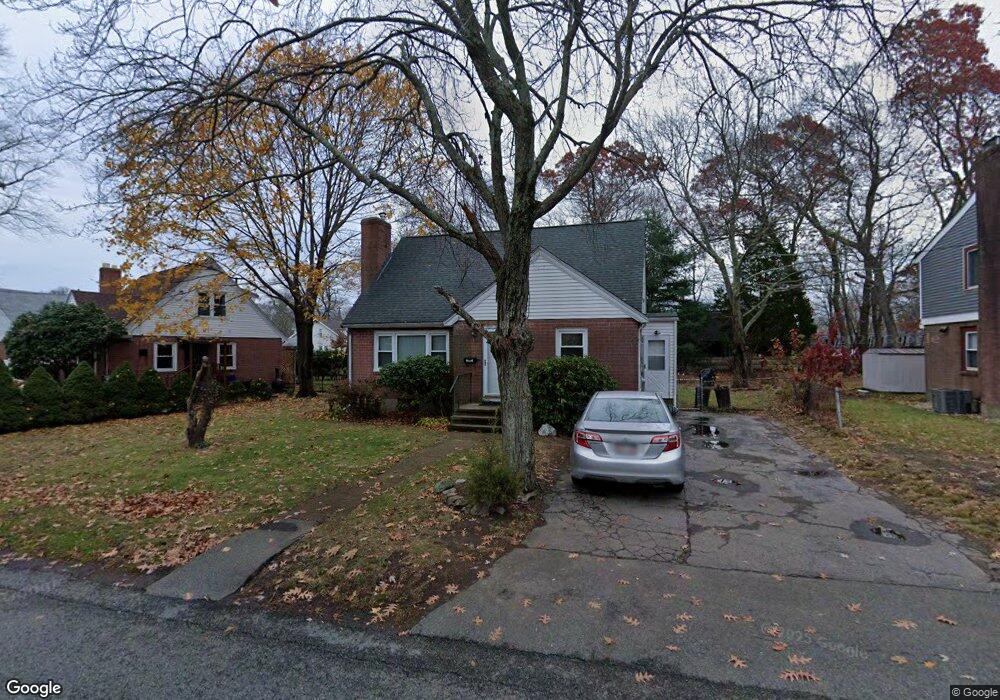
111 Cross St Unit 111 Randolph, MA 02368
North Randolph NeighborhoodEstimated Value: $482,000 - $577,000
3
Beds
2
Baths
1,617
Sq Ft
$333/Sq Ft
Est. Value
About This Home
This home is located at 111 Cross St Unit 111, Randolph, MA 02368 and is currently estimated at $539,006, approximately $333 per square foot. 111 Cross St Unit 111 is a home located in Norfolk County with nearby schools including Randolph High School, Boston Higashi School, and Lighthouse Baptist Christian Academy.
Ownership History
Date
Name
Owned For
Owner Type
Purchase Details
Closed on
Mar 2, 2012
Sold by
Lee Bun F and Lee Christine S
Bought by
Sharpe Michael N and Sharpe Giselle E
Current Estimated Value
Home Financials for this Owner
Home Financials are based on the most recent Mortgage that was taken out on this home.
Original Mortgage
$199,845
Outstanding Balance
$137,345
Interest Rate
3.88%
Mortgage Type
New Conventional
Estimated Equity
$401,661
Create a Home Valuation Report for This Property
The Home Valuation Report is an in-depth analysis detailing your home's value as well as a comparison with similar homes in the area
Home Values in the Area
Average Home Value in this Area
Purchase History
| Date | Buyer | Sale Price | Title Company |
|---|---|---|---|
| Sharpe Michael N | $190,000 | -- |
Source: Public Records
Mortgage History
| Date | Status | Borrower | Loan Amount |
|---|---|---|---|
| Open | Sharpe Michael N | $199,845 |
Source: Public Records
Tax History Compared to Growth
Tax History
| Year | Tax Paid | Tax Assessment Tax Assessment Total Assessment is a certain percentage of the fair market value that is determined by local assessors to be the total taxable value of land and additions on the property. | Land | Improvement |
|---|---|---|---|---|
| 2025 | $5,164 | $444,800 | $227,700 | $217,100 |
| 2024 | $4,996 | $436,300 | $223,200 | $213,100 |
| 2023 | $4,805 | $397,800 | $202,900 | $194,900 |
| 2022 | $4,799 | $352,900 | $169,100 | $183,800 |
| 2021 | $4,469 | $302,400 | $140,900 | $161,500 |
| 2020 | $4,375 | $293,400 | $140,900 | $152,500 |
| 2019 | $4,160 | $277,700 | $134,200 | $143,500 |
| 2018 | $3,932 | $247,600 | $122,000 | $125,600 |
| 2017 | $3,843 | $237,500 | $116,200 | $121,300 |
| 2016 | $3,699 | $212,700 | $105,600 | $107,100 |
| 2015 | $3,535 | $195,300 | $100,600 | $94,700 |
Source: Public Records
Map
Nearby Homes
- 18 Jasper Ln
- 12 Jasper Ln Unit 12
- 54 Jasper Ln
- 16 Simmonds Blvd Unit 16
- 20 Simmonds Blvd Unit 20
- 14 Simmonds Blvd Unit 14
- 12 Simmonds Blvd Unit 12
- 33 Liberty St
- 591 N Main St
- 20 Nelson Dr Unit 3A
- 44 Liberty St
- 73 Belcher St
- 47 West St Unit A2
- 34 Orchard St
- 43 Emily Jeffers Rd
- 2 Smith Rd
- 28 Silver St
- 1 Clark Cir
- 17 Mazzeo Dr
- 12 Cottage St