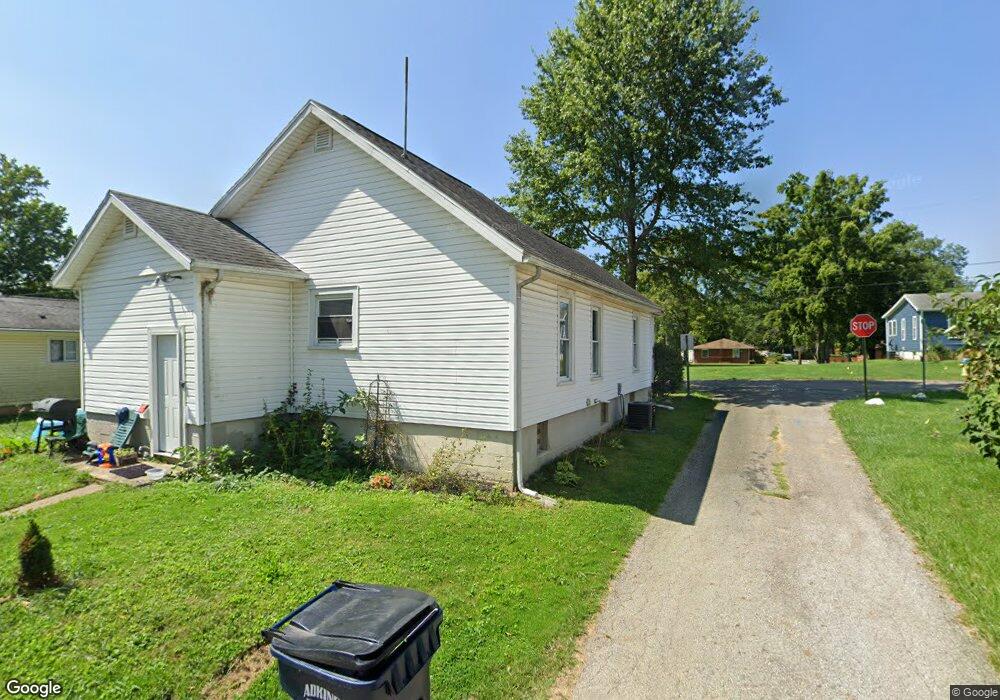
111 Dennison St Hebron, OH 43025
Estimated Value: $191,000 - $222,000
2
Beds
1
Bath
760
Sq Ft
$274/Sq Ft
Est. Value
About This Home
This home is located at 111 Dennison St, Hebron, OH 43025 and is currently estimated at $207,917, approximately $273 per square foot. 111 Dennison St is a home located in Licking County with nearby schools including Jackson Intermediate School, Lakewood Middle School, and Lakewood High School.
Ownership History
Date
Name
Owned For
Owner Type
Purchase Details
Closed on
Aug 17, 2021
Sold by
Rafferty Sean
Bought by
Rafferty Angela Denise
Current Estimated Value
Purchase Details
Closed on
Apr 27, 2018
Sold by
Cady Richard E and Cady Jacquelins S
Bought by
Rafferty Angela Denise and Rafferty Sean
Home Financials for this Owner
Home Financials are based on the most recent Mortgage that was taken out on this home.
Original Mortgage
$66,137
Outstanding Balance
$57,232
Interest Rate
4.62%
Mortgage Type
FHA
Estimated Equity
$150,685
Purchase Details
Closed on
Jun 10, 2003
Sold by
Graham Kathy B
Bought by
Cady Richard E and Cady Jacqueline S
Purchase Details
Closed on
Dec 27, 1994
Sold by
Dooley Andrea L
Bought by
Graham Kathy B
Home Financials for this Owner
Home Financials are based on the most recent Mortgage that was taken out on this home.
Original Mortgage
$54,900
Interest Rate
9.19%
Mortgage Type
New Conventional
Create a Home Valuation Report for This Property
The Home Valuation Report is an in-depth analysis detailing your home's value as well as a comparison with similar homes in the area
Home Values in the Area
Average Home Value in this Area
Purchase History
| Date | Buyer | Sale Price | Title Company |
|---|---|---|---|
| Rafferty Angela Denise | -- | None Available | |
| Rafferty Angela Denise | $78,000 | Servicelink Llc | |
| Cady Richard E | $82,000 | -- | |
| Graham Kathy B | $54,900 | -- |
Source: Public Records
Mortgage History
| Date | Status | Borrower | Loan Amount |
|---|---|---|---|
| Open | Rafferty Angela Denise | $66,137 | |
| Previous Owner | Graham Kathy B | $54,900 |
Source: Public Records
Tax History Compared to Growth
Tax History
| Year | Tax Paid | Tax Assessment Tax Assessment Total Assessment is a certain percentage of the fair market value that is determined by local assessors to be the total taxable value of land and additions on the property. | Land | Improvement |
|---|---|---|---|---|
| 2024 | $2,072 | $50,090 | $18,200 | $31,890 |
| 2023 | $2,081 | $50,090 | $18,200 | $31,890 |
| 2022 | $1,849 | $37,740 | $9,560 | $28,180 |
| 2021 | $1,839 | $37,740 | $9,560 | $28,180 |
| 2020 | $1,899 | $37,740 | $9,560 | $28,180 |
| 2019 | $1,596 | $29,230 | $9,100 | $20,130 |
| 2018 | $1,650 | $0 | $0 | $0 |
| 2017 | $1,518 | $0 | $0 | $0 |
| 2016 | $1,475 | $0 | $0 | $0 |
| 2015 | $1,428 | $0 | $0 | $0 |
| 2014 | $2,168 | $0 | $0 | $0 |
| 2013 | $1,560 | $0 | $0 | $0 |
Source: Public Records
Map
Nearby Homes
- 107 Wooster St
- 575 E Main St
- 3313 Butternut Ln
- 153 S High St
- 107 Greenbriar Ln W Unit Lot 4
- 106 Newark St
- 217 Raspberry Cir W
- 1144 Lake Forest Dr
- 121 Greenbriar Ln W
- 814 W Main St
- 140 Hamilton Ave
- 104 Cumberland Meadows Cir
- 0 Refugee Rd SE Unit 225031623
- 165 Worth Dr
- 11047 Hebron Rd
- 11007 Hebron Rd
- 173 Highland Ave
- 331 Highland Ave
- 11116 Hebron Rd
- 142 Narragansett Dr
- 109 Dennison St
- 0 Dennison St
- 110 Buckeye St
- 115 Dennison St
- 107 Dennison St
- 116 Buckeye St
- 112 Buckeye St
- 114 Buckeye St
- 114 Dennison St
- 110 Dennison St
- 117 Dennison St
- 105 Dennison St
- 116 Dennison St
- 108 Buckeye St
- 118 Dennison St
- 109 Parks Ave
- 119 Dennison St
- 121 Parks Ave
- 115 Parks Ave
- 111 Buckeye St