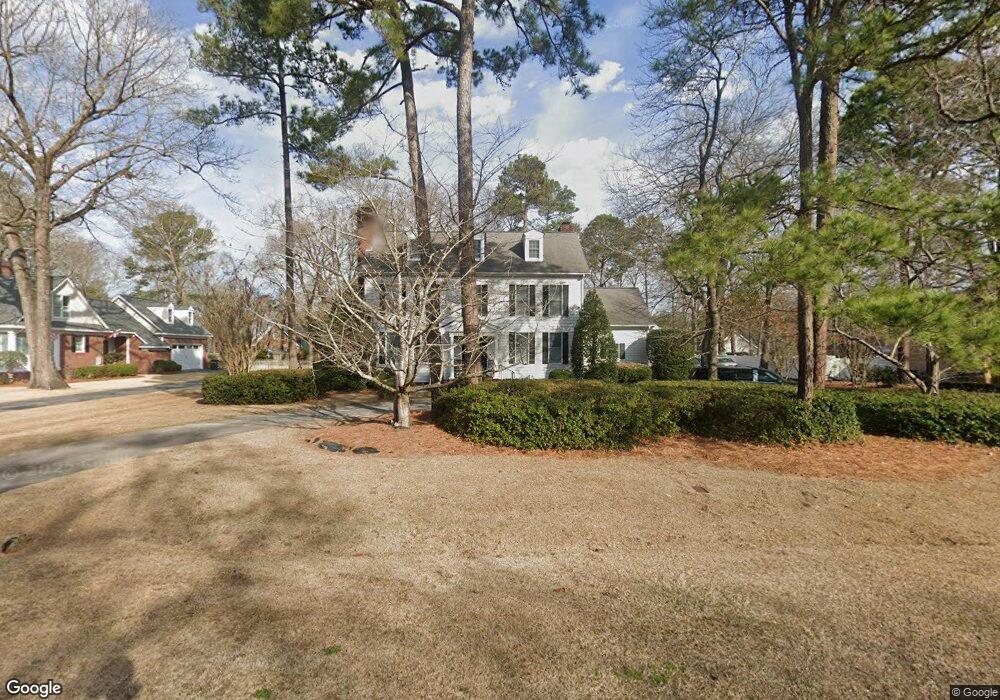
111 Dobbs Place Goldsboro, NC 27534
Estimated Value: $622,178 - $704,000
3
Beds
5
Baths
3,623
Sq Ft
$181/Sq Ft
Est. Value
About This Home
This home is located at 111 Dobbs Place, Goldsboro, NC 27534 and is currently estimated at $657,545, approximately $181 per square foot. 111 Dobbs Place is a home located in Wayne County with nearby schools including Spring Creek Elementary School, Spring Creek Middle School, and Spring Creek High School.
Ownership History
Date
Name
Owned For
Owner Type
Purchase Details
Closed on
May 27, 2016
Sold by
Hughes Duncan G and Hughes Heidi H
Bought by
Simmons Otis R and Simmons Shonta T
Current Estimated Value
Home Financials for this Owner
Home Financials are based on the most recent Mortgage that was taken out on this home.
Original Mortgage
$363,000
Outstanding Balance
$295,138
Interest Rate
4.25%
Mortgage Type
New Conventional
Estimated Equity
$362,407
Purchase Details
Closed on
Jul 15, 2010
Sold by
Kolleda Mark V and Kolleda Colleen S
Bought by
Hughes Duncan G and Hughes Heidi H
Home Financials for this Owner
Home Financials are based on the most recent Mortgage that was taken out on this home.
Original Mortgage
$299,700
Interest Rate
3.25%
Mortgage Type
VA
Purchase Details
Closed on
Aug 1, 2003
Purchase Details
Closed on
Apr 1, 1999
Purchase Details
Closed on
Dec 1, 1998
Create a Home Valuation Report for This Property
The Home Valuation Report is an in-depth analysis detailing your home's value as well as a comparison with similar homes in the area
Home Values in the Area
Average Home Value in this Area
Purchase History
| Date | Buyer | Sale Price | Title Company |
|---|---|---|---|
| Simmons Otis R | $363,000 | None Available | |
| Hughes Duncan G | $370,000 | None Available | |
| -- | $362,500 | -- | |
| -- | $366,500 | -- | |
| -- | $422,000 | -- |
Source: Public Records
Mortgage History
| Date | Status | Borrower | Loan Amount |
|---|---|---|---|
| Open | Simmons Otis R | $363,000 | |
| Previous Owner | Hughes Duncan G | $299,700 |
Source: Public Records
Tax History Compared to Growth
Tax History
| Year | Tax Paid | Tax Assessment Tax Assessment Total Assessment is a certain percentage of the fair market value that is determined by local assessors to be the total taxable value of land and additions on the property. | Land | Improvement |
|---|---|---|---|---|
| 2025 | $5,462 | $610,780 | $75,000 | $535,780 |
| 2024 | $5,462 | $437,820 | $65,000 | $372,820 |
| 2023 | $5,352 | $437,820 | $65,000 | $372,820 |
| 2022 | $5,352 | $437,820 | $65,000 | $372,820 |
| 2021 | $4,936 | $437,820 | $65,000 | $372,820 |
| 2020 | $4,744 | $437,820 | $65,000 | $372,820 |
| 2018 | $4,697 | $370,610 | $65,000 | $305,610 |
| 2017 | $4,016 | $370,610 | $65,000 | $305,610 |
| 2016 | $3,858 | $370,610 | $65,000 | $305,610 |
| 2015 | $2,465 | $370,610 | $65,000 | $305,610 |
| 2014 | $2,470 | $370,610 | $65,000 | $305,610 |
Source: Public Records
Map
Nearby Homes
- 206 Tramway Place
- 105 Myrtle Rd
- 443 Dogwood Trail
- 328 S Beston Rd
- 101 Hudson Village Dr
- 100 Hudson Village Dr Unit (Lot 1)
- 102 Hudson Village Dr Unit (Lot 2)
- 107 Hudson Village Dr Unit (Lot 75)
- 104 Hudson Village Dr
- 100 Glasgow Ln
- 405 Dogwood Trail
- 109 Hudson Village Dr Unit (Lot 74)
- 106 Hudson Village Dr
- 421 Dogwood Trail
- 111 Hudson Village Dr Unit (Lot 73)
- 108 Hudson Village Dr
- 102 Brighton St
- 110 Hudson Village Dr
- 103 Brighton St